

Slides
Operating Model Presentation Design
Meridian Freight turns an operating-model diagnosis into a focused decision deck, linking cost pressure, strategic choices, value, and an 18-month roadmap.

Operating Model Use Cases
- Board Decision DecksFrame one operating choice for senior decision-makers.
- Operating Model ReviewsConnect process breakdowns to structural interventions.
- Transformation RoadmapsSequence change across phases, cohorts, and ownership.
- Strategy Case NarrativesMove from diagnosis to recommendation without losing context.
Decision Deck Highlights
- Diagnosis FirstOpens with cost pressure and operating symptoms.
- Three-Path ComparisonMakes tradeoffs visible before naming Option C.
- Value FramingPairs reduction, approval time, and payback.
- Decision CloseEnds with a specific approval and funding request.
Meridian Freight Slides
1 / 7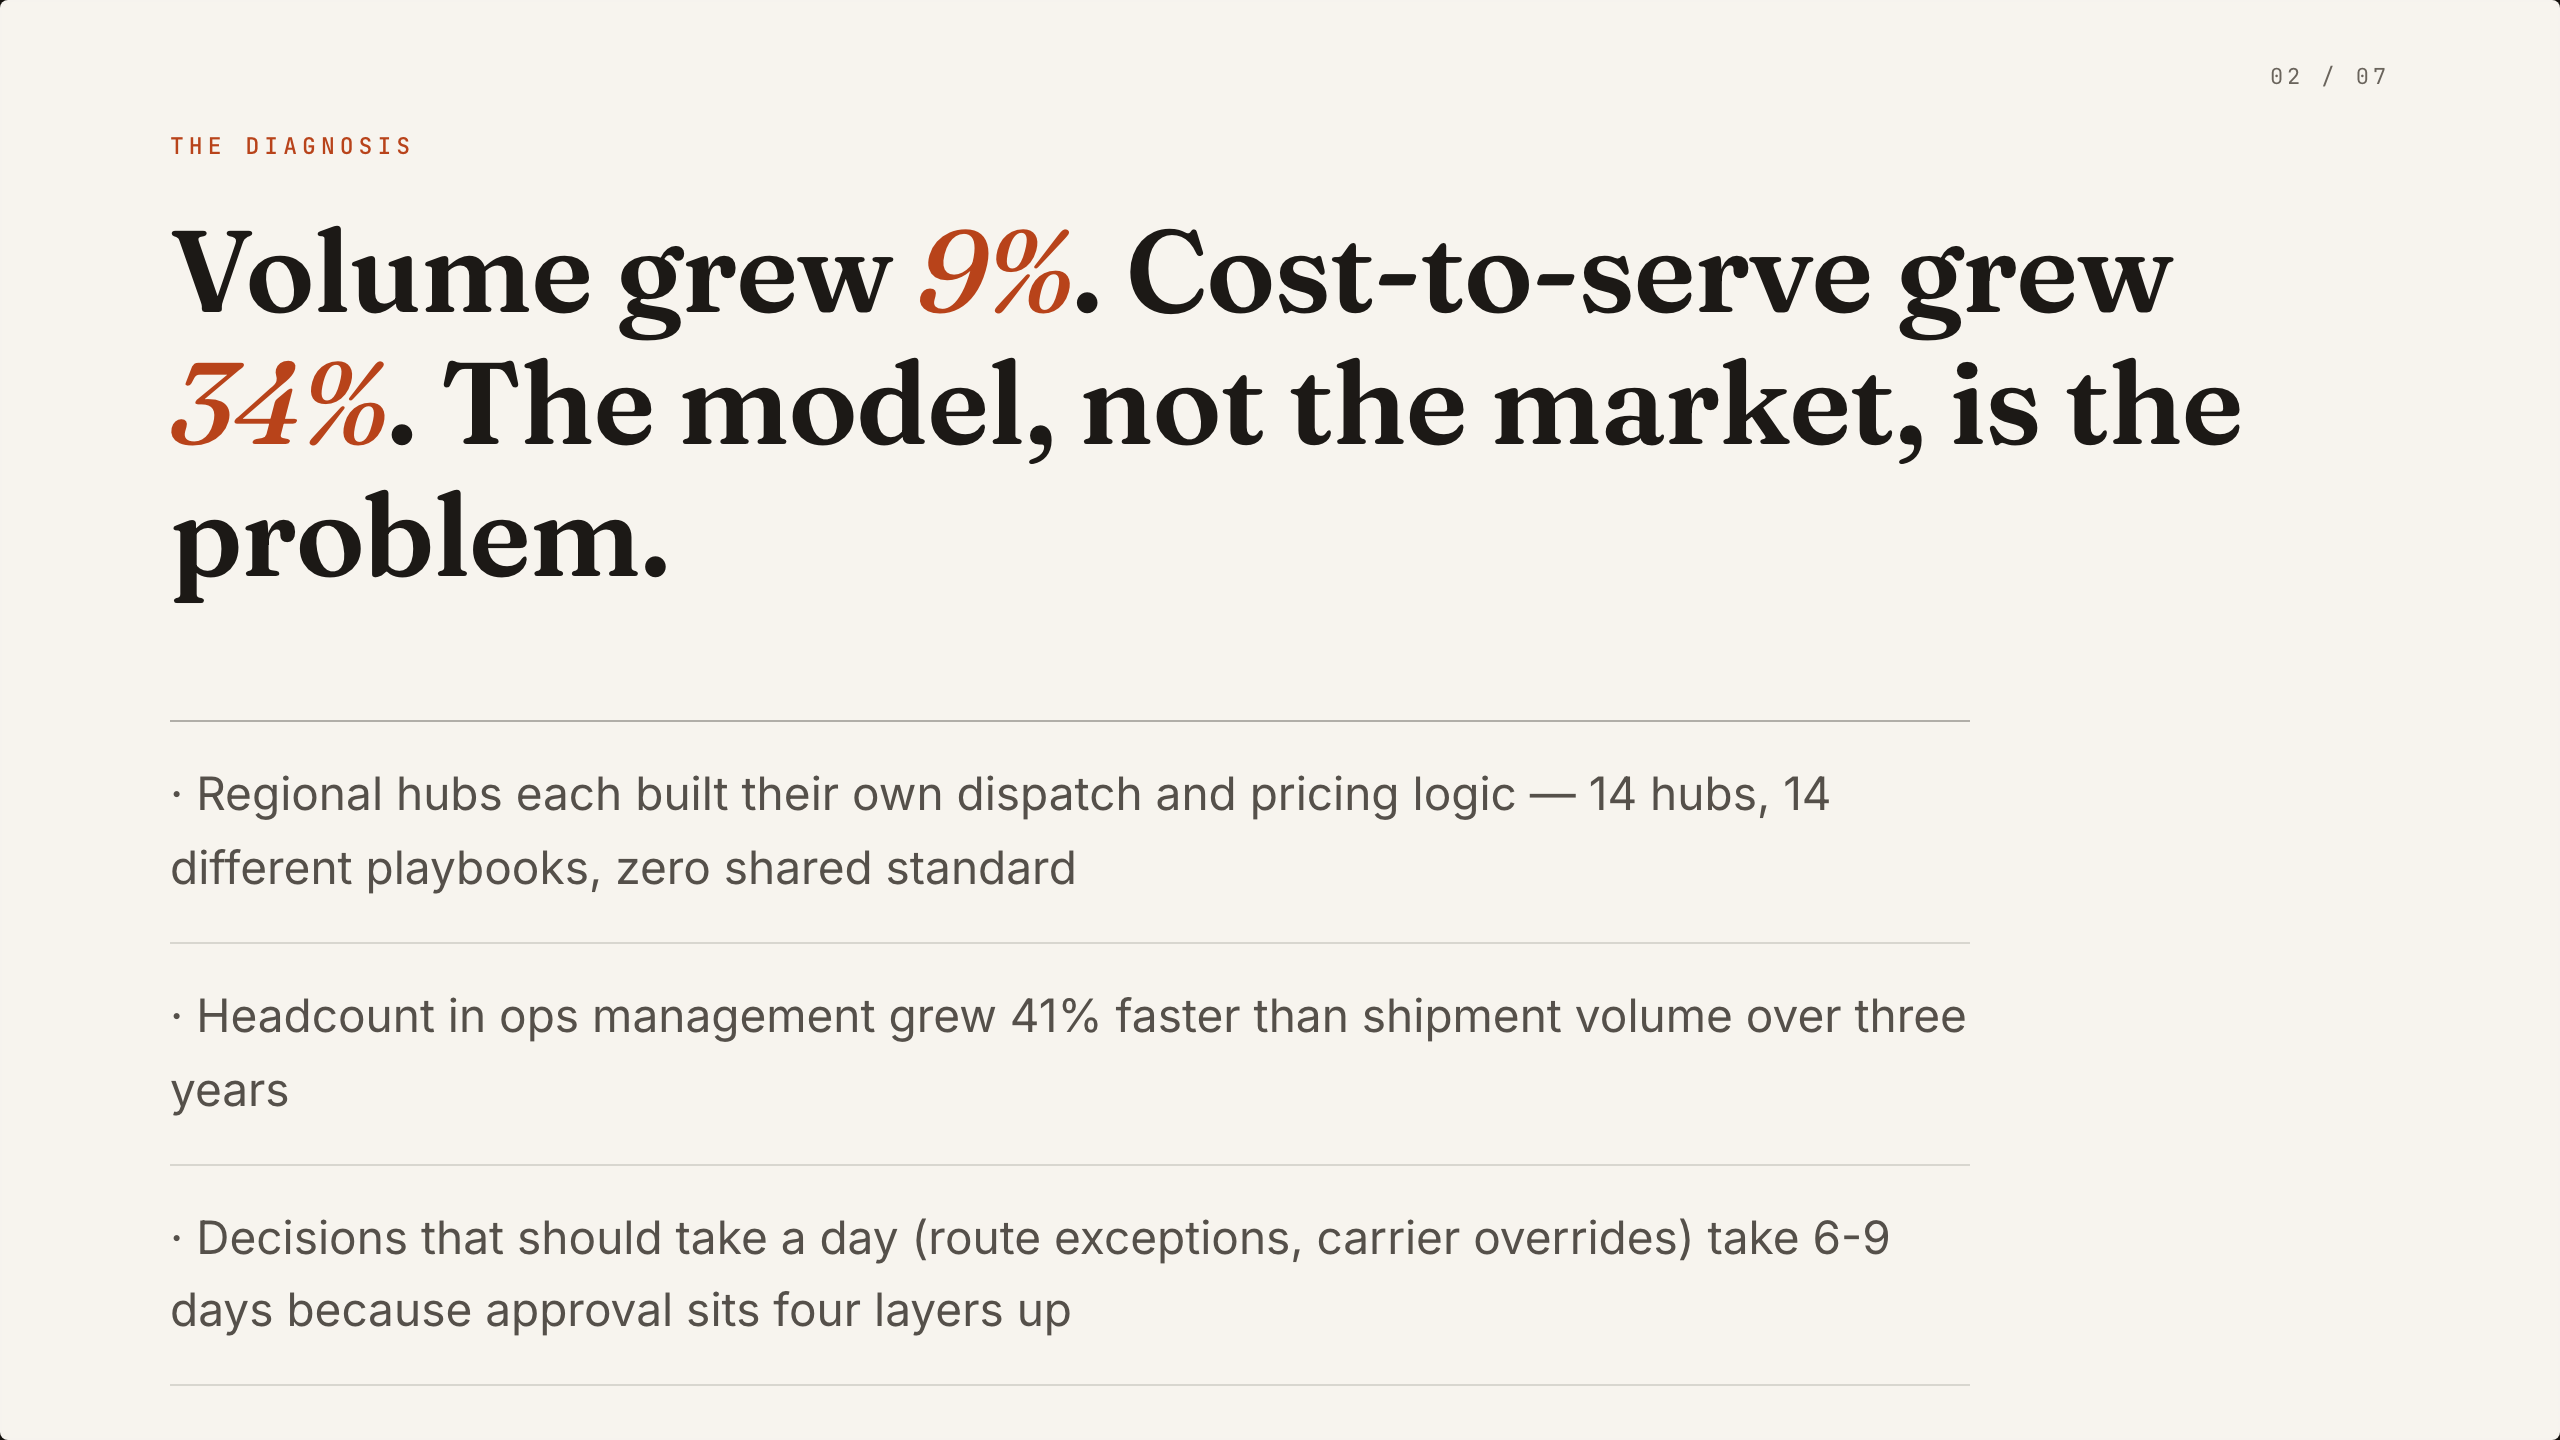

Meridian Freight's Decision Narrative
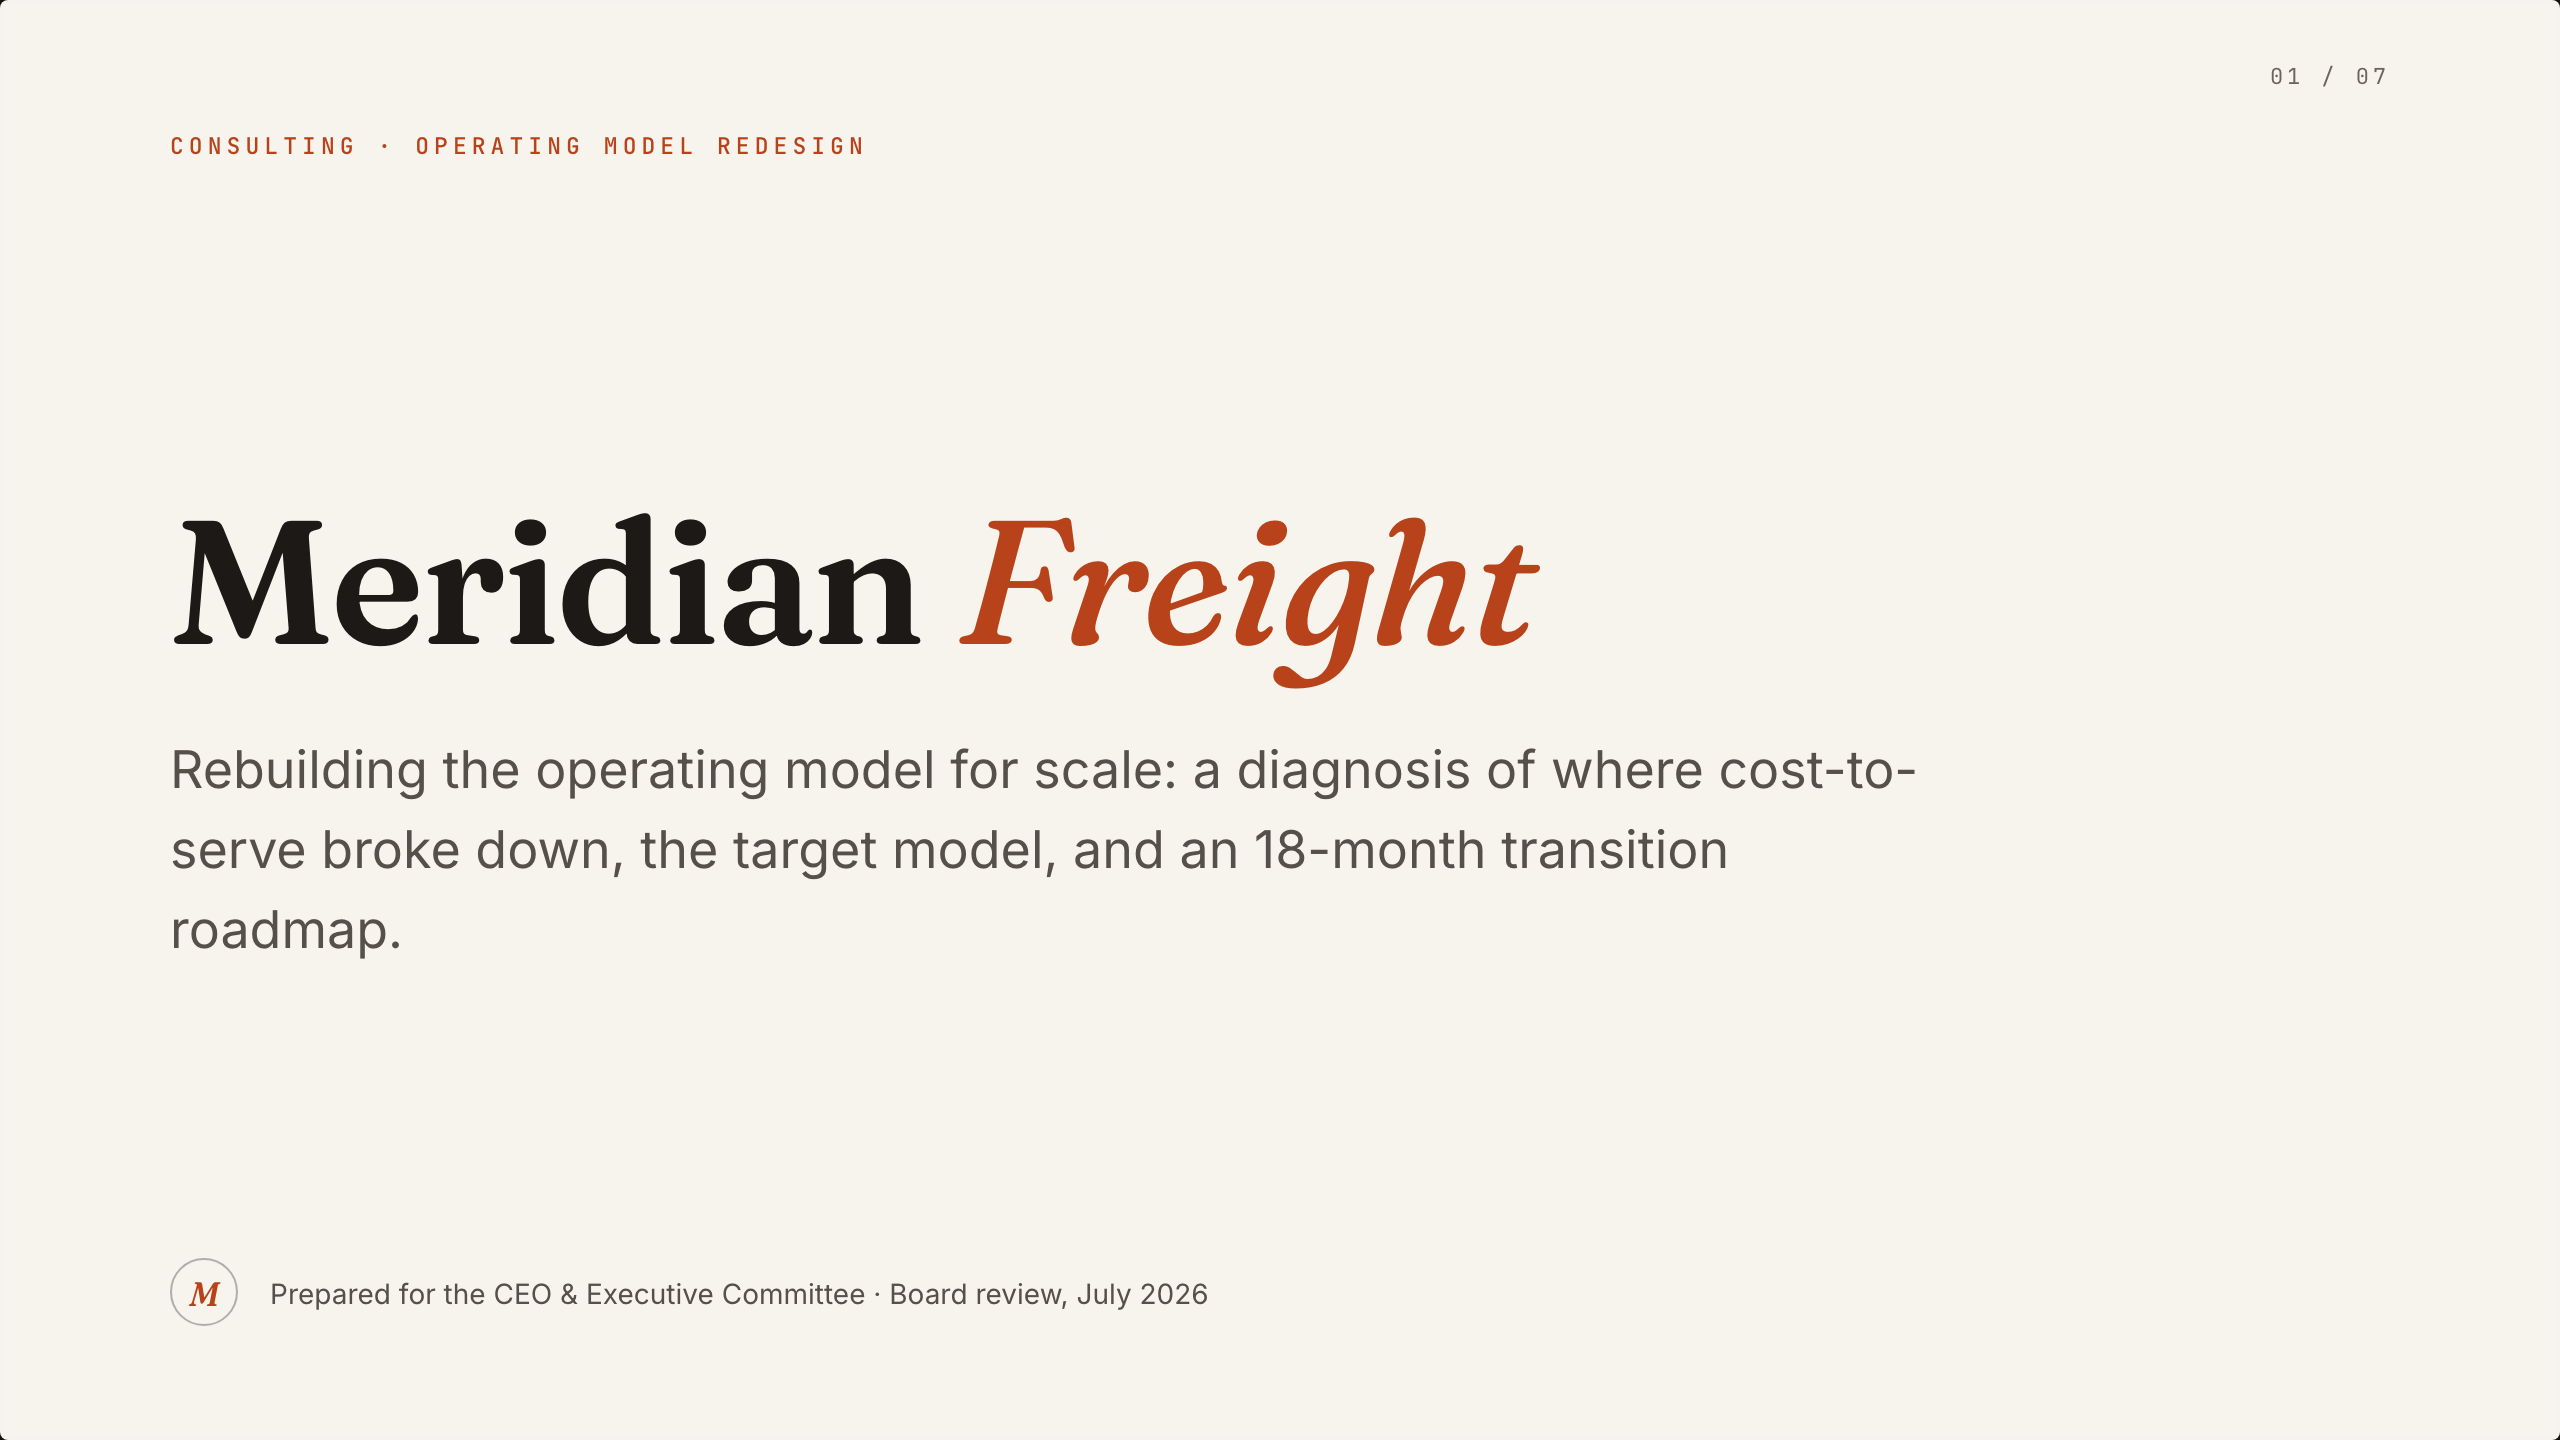
This seven-slide presentation design is a consulting-style decision narrative for the fictional Meridian Freight scenario. Its stated purpose is to diagnose where cost-to-serve broke down, define a target operating model, and present an 18-month transition roadmap. The deck is designed for a CEO, executive committee, and board-review setting, so each slide advances the decision rather than introducing a broad collection of operational detail.
The opening slide establishes the subject with the large serif title “Meridian Freight” and the subtitle “Rebuilding the operating model for scale.” The next slide immediately supplies the tension: volume grew 9%, while cost-to-serve grew 34%. That ordering makes the business problem legible before the presentation introduces its proposed operating model.
OpenDesign distributes this example in its Community library, with HTMLAnything credited as the declared template upstream. The layout pairs Fraunces serif headlines with Inter body copy and JetBrains Mono metadata. Warm cream backgrounds and rust italic accents carry the argument, while thin rules organize the options. The dark closing slide marks the shift from analysis to an approval request.
Diagnosis
The deck names 14 hubs, 14 dispatch and pricing playbooks, and approval delays of 6–9 days to turn abstract operating friction into recognizable symptoms.
Governing Thought
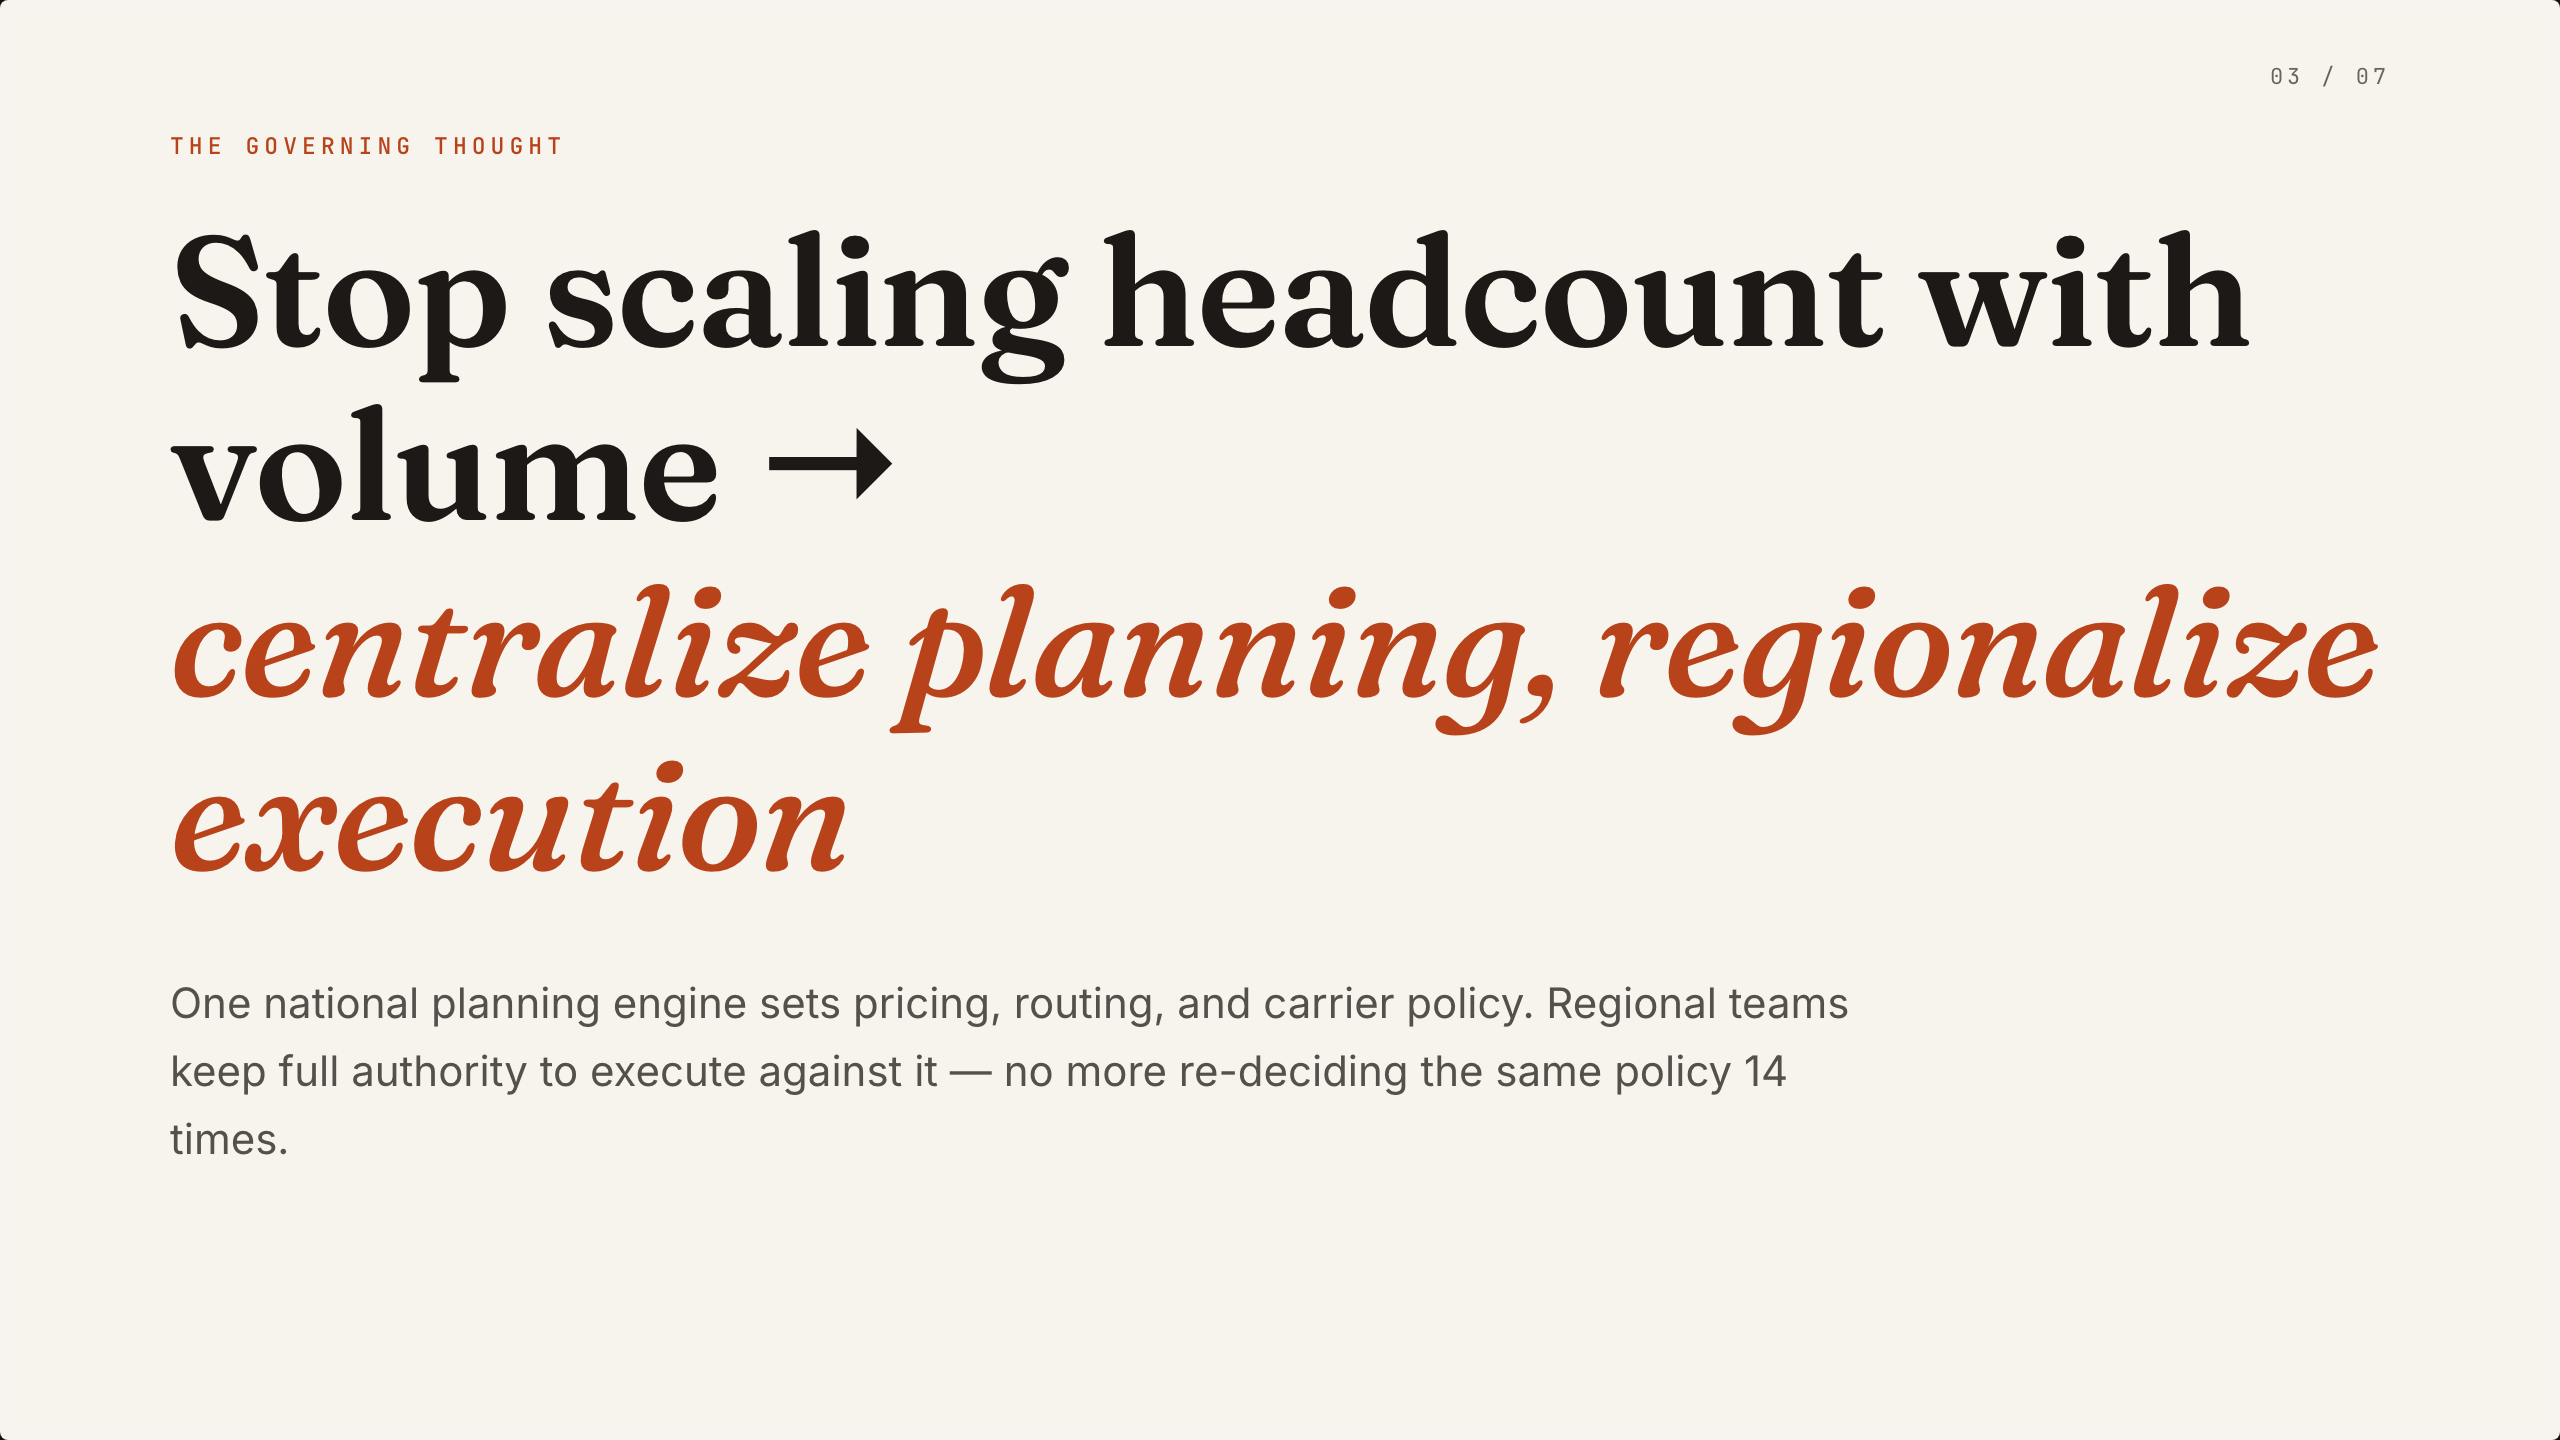
“Centralize planning, regionalize execution” becomes the organizing principle, preserving local execution while removing repeated policy decisions.
Decision Request
The final slide asks for Option C, a transition owner, and the first $2.1M tranche, giving the narrative a concrete endpoint.
A Deck Built For Executive Comparison
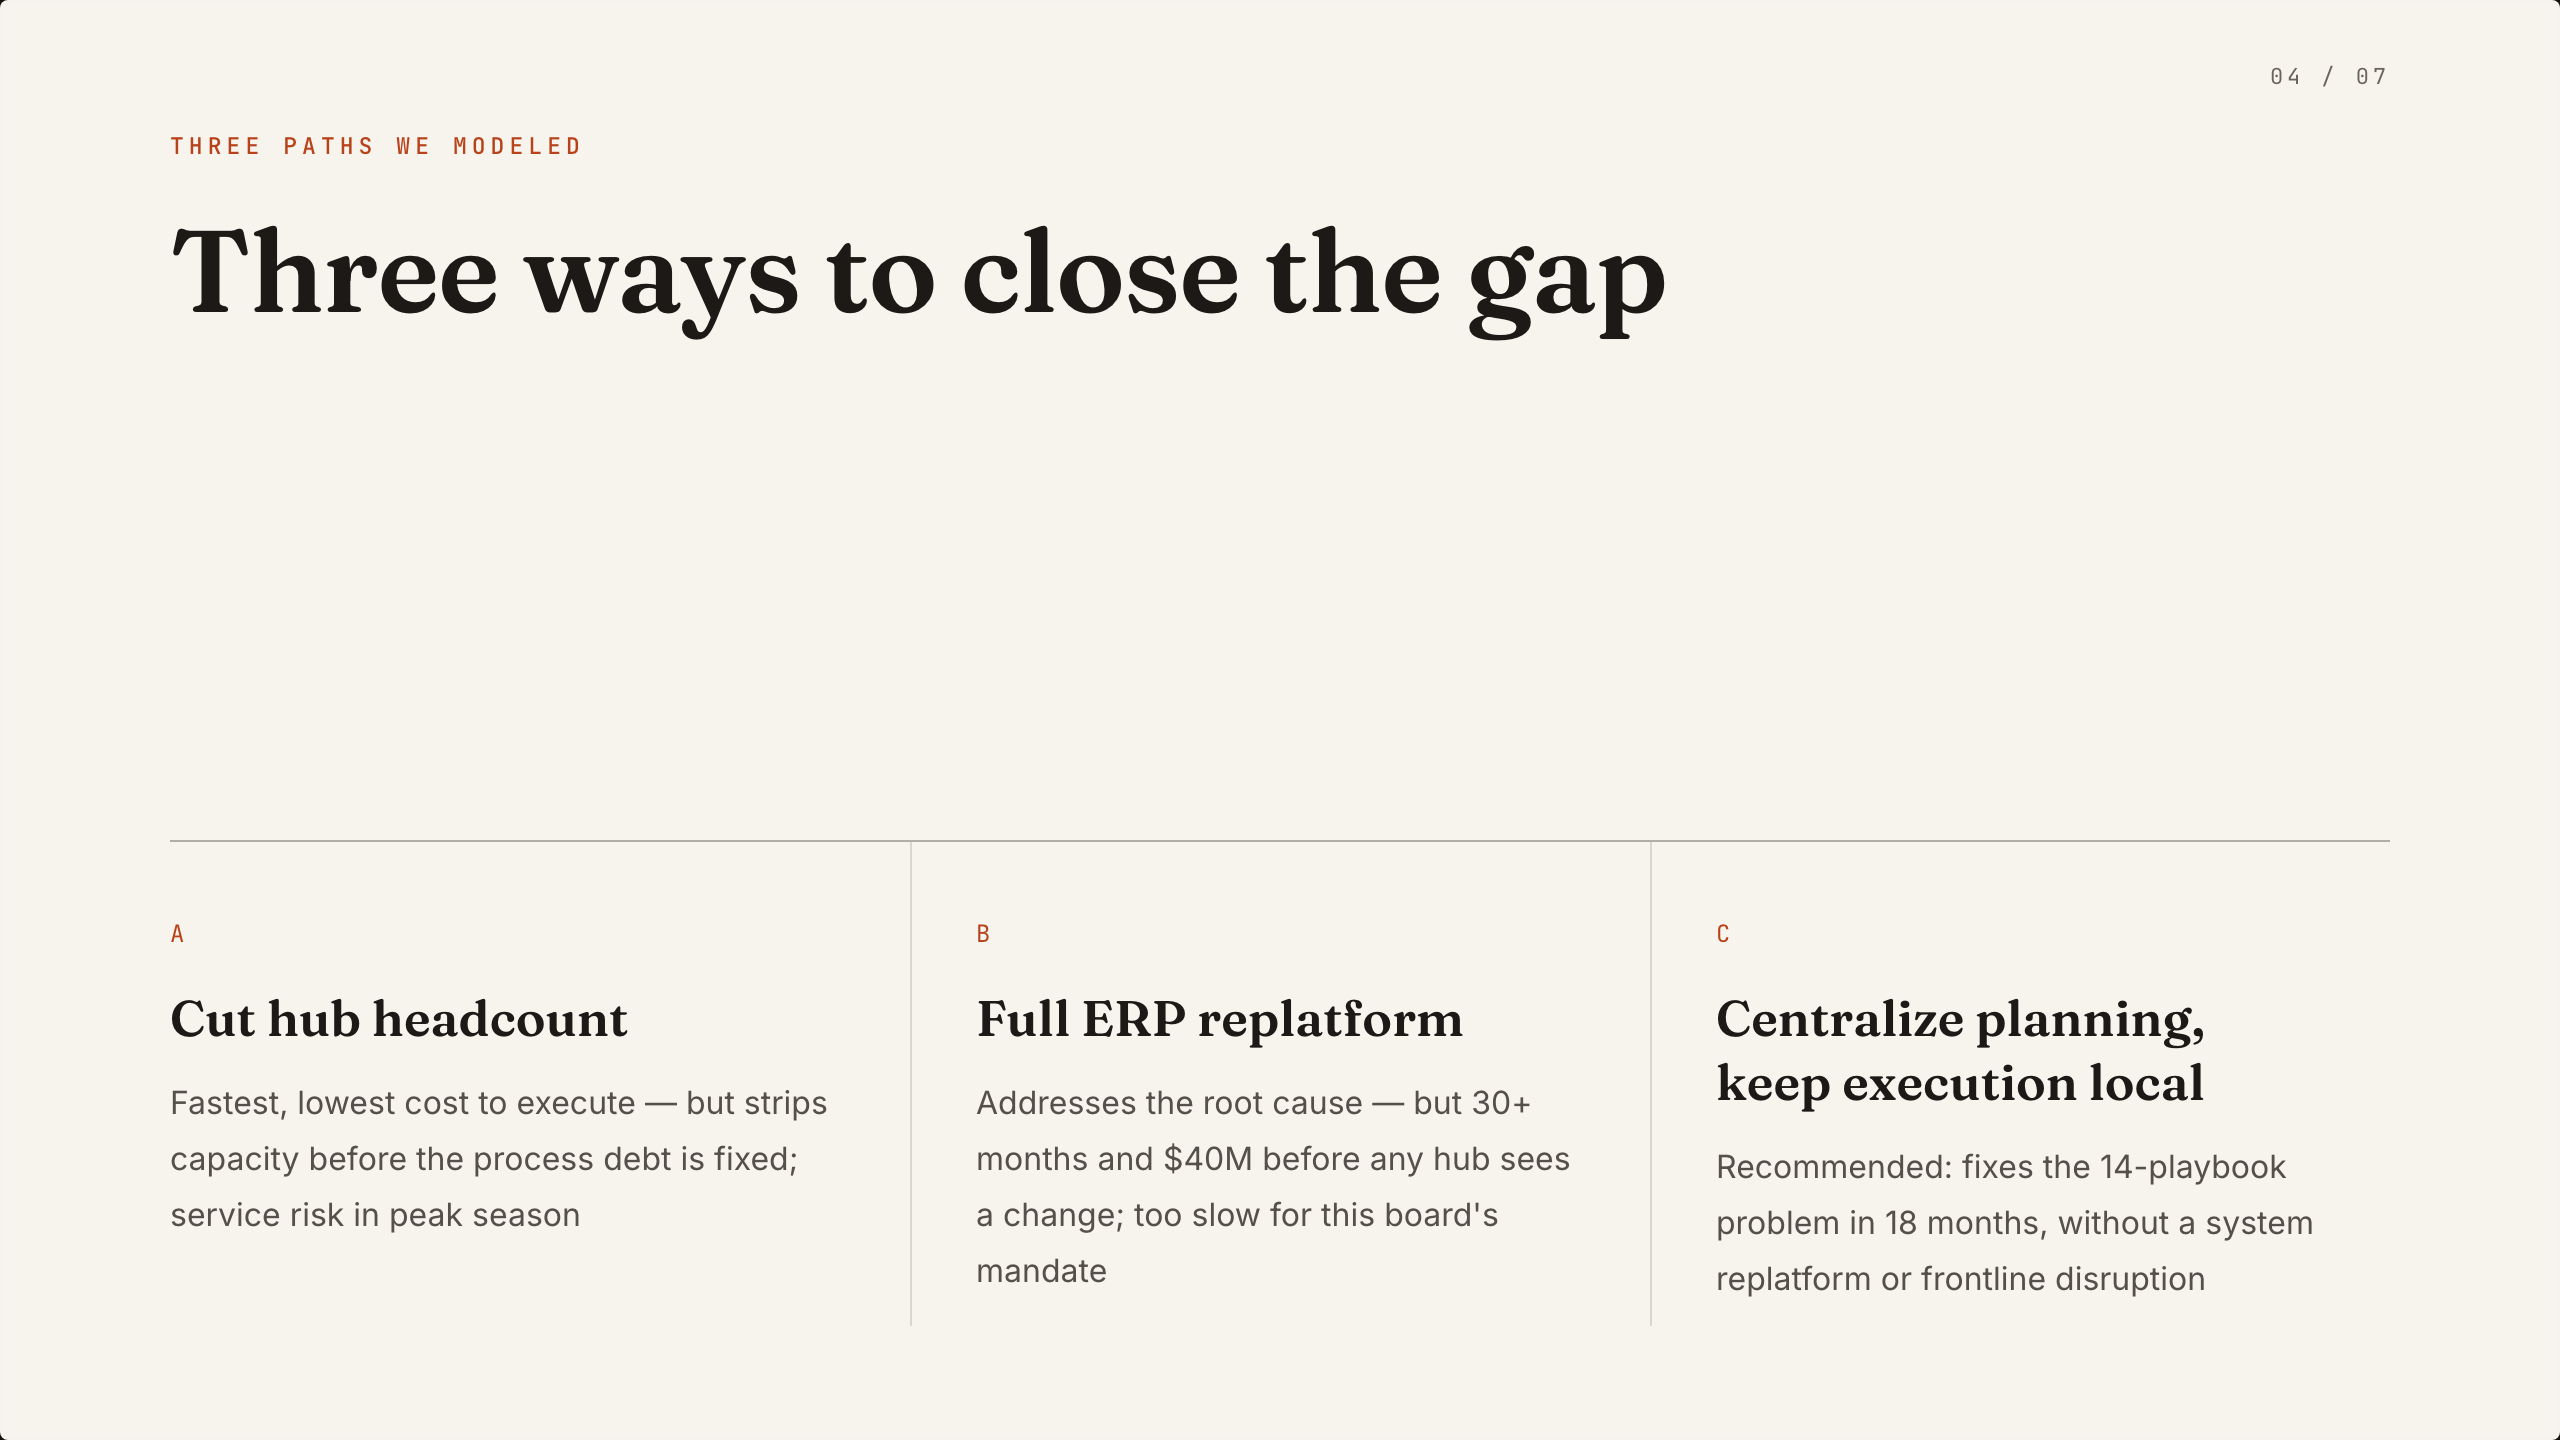
The design is useful when an audience must compare strategic paths under a time constraint. Slide 4 presents three vertically separated choices: cutting hub headcount, a full ERP replatform, and centralizing planning while keeping execution local. The repeated A, B, and C markers support scanning, while the body copy preserves the tradeoff attached to each choice.
The comparison works because the options are not presented as interchangeable feature lists. Option A is described as fast but risky during peak season; Option B addresses the root cause but takes more than 30 months and $40M; Option C is framed as the recommended middle path. The tradeoff is explicit, although the figures remain illustrative scenario content rather than validated business results.
Executive Review
Use the structure when leadership needs the recommendation, its alternatives, and its downside visible in one reading sequence.
Transformation Planning
Use the later slides to connect a selected model to cohorts, phases, timing, and a named transition owner.
Illustrative Strategy Work
Use the visual language for a sample case while labeling figures and claims as scenario content.
From Cost Pressure To The Ask
The sequence follows a disciplined consulting argument. Slide 2 diagnoses the problem through three observations: fragmented playbooks across 14 hubs, management headcount growing 41% faster than shipment volume, and exception decisions taking 6–9 days. Slide 3 converts those symptoms into the governing thought: one national planning engine sets pricing, routing, and carrier policy, while regional teams retain execution authority.
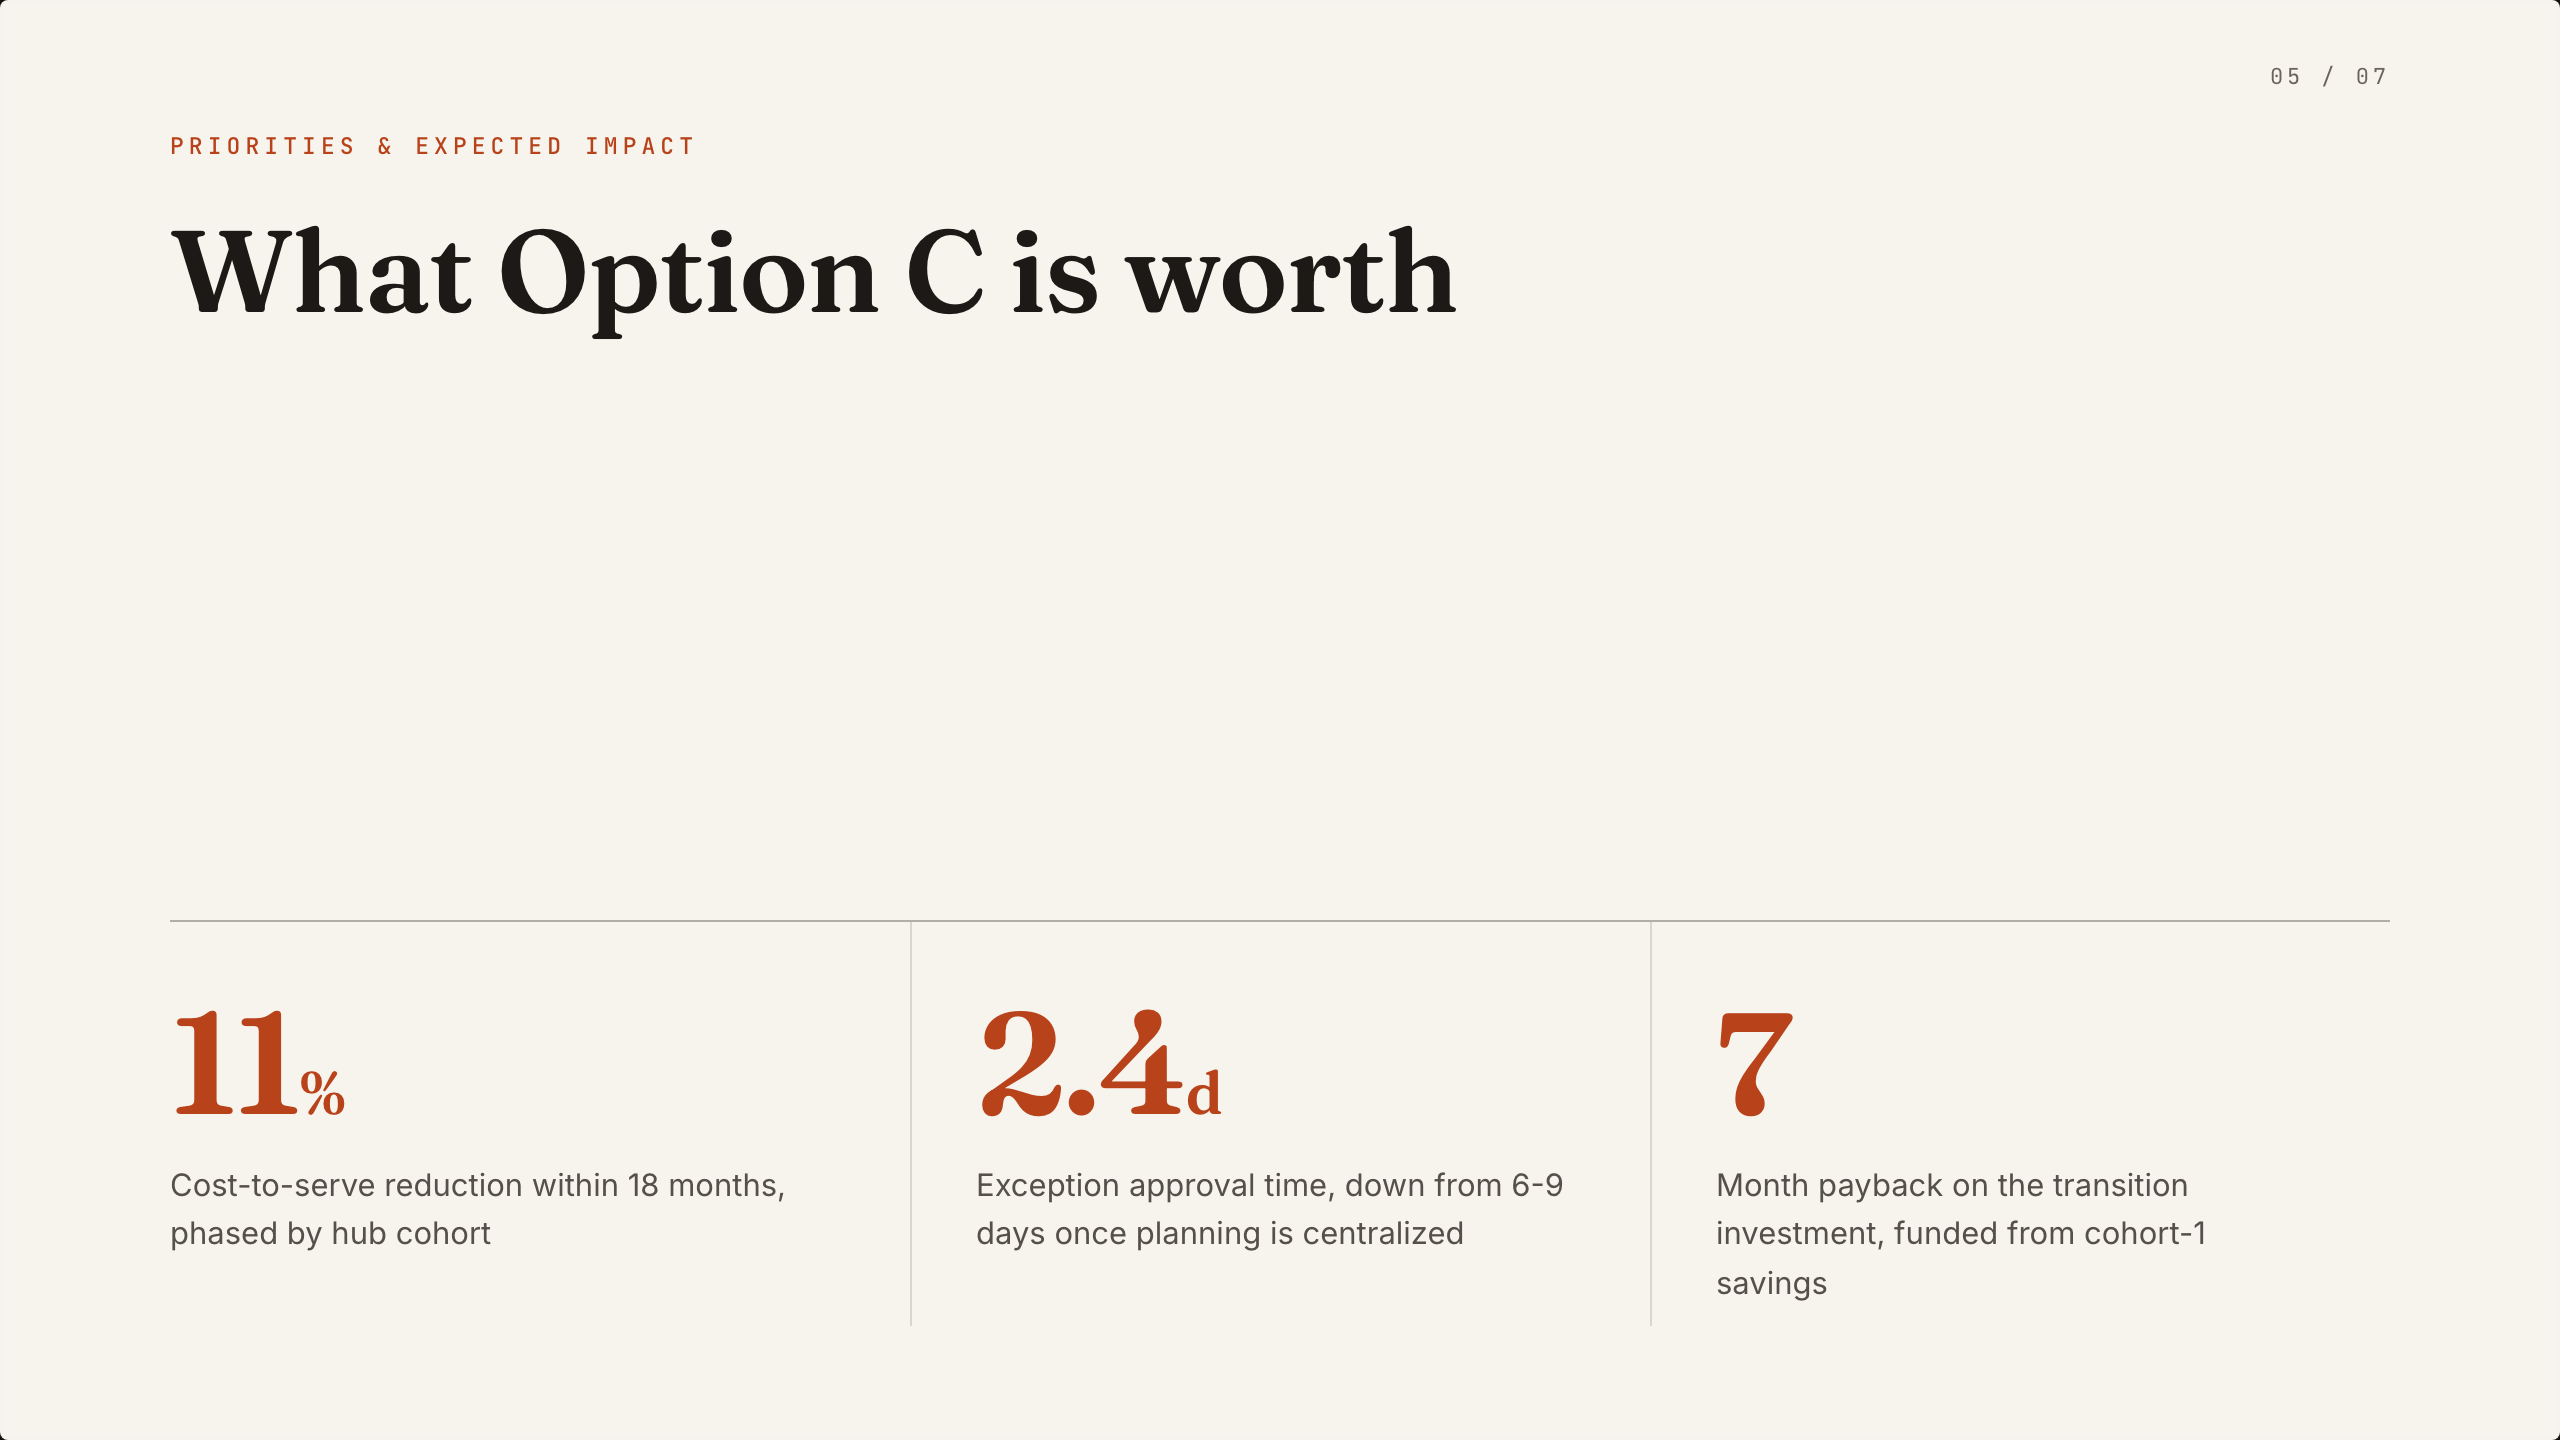
Slide 5 then translates Option C into three headline measures: an illustrative 11% cost-to-serve reduction within 18 months, 2.4 days for exception approval, and a seven-month payback. These values are visually easy to scan, but the deck does not define the measurement method behind them. That makes the slide effective for framing a business case while leaving validation and calculation outside the presentation.
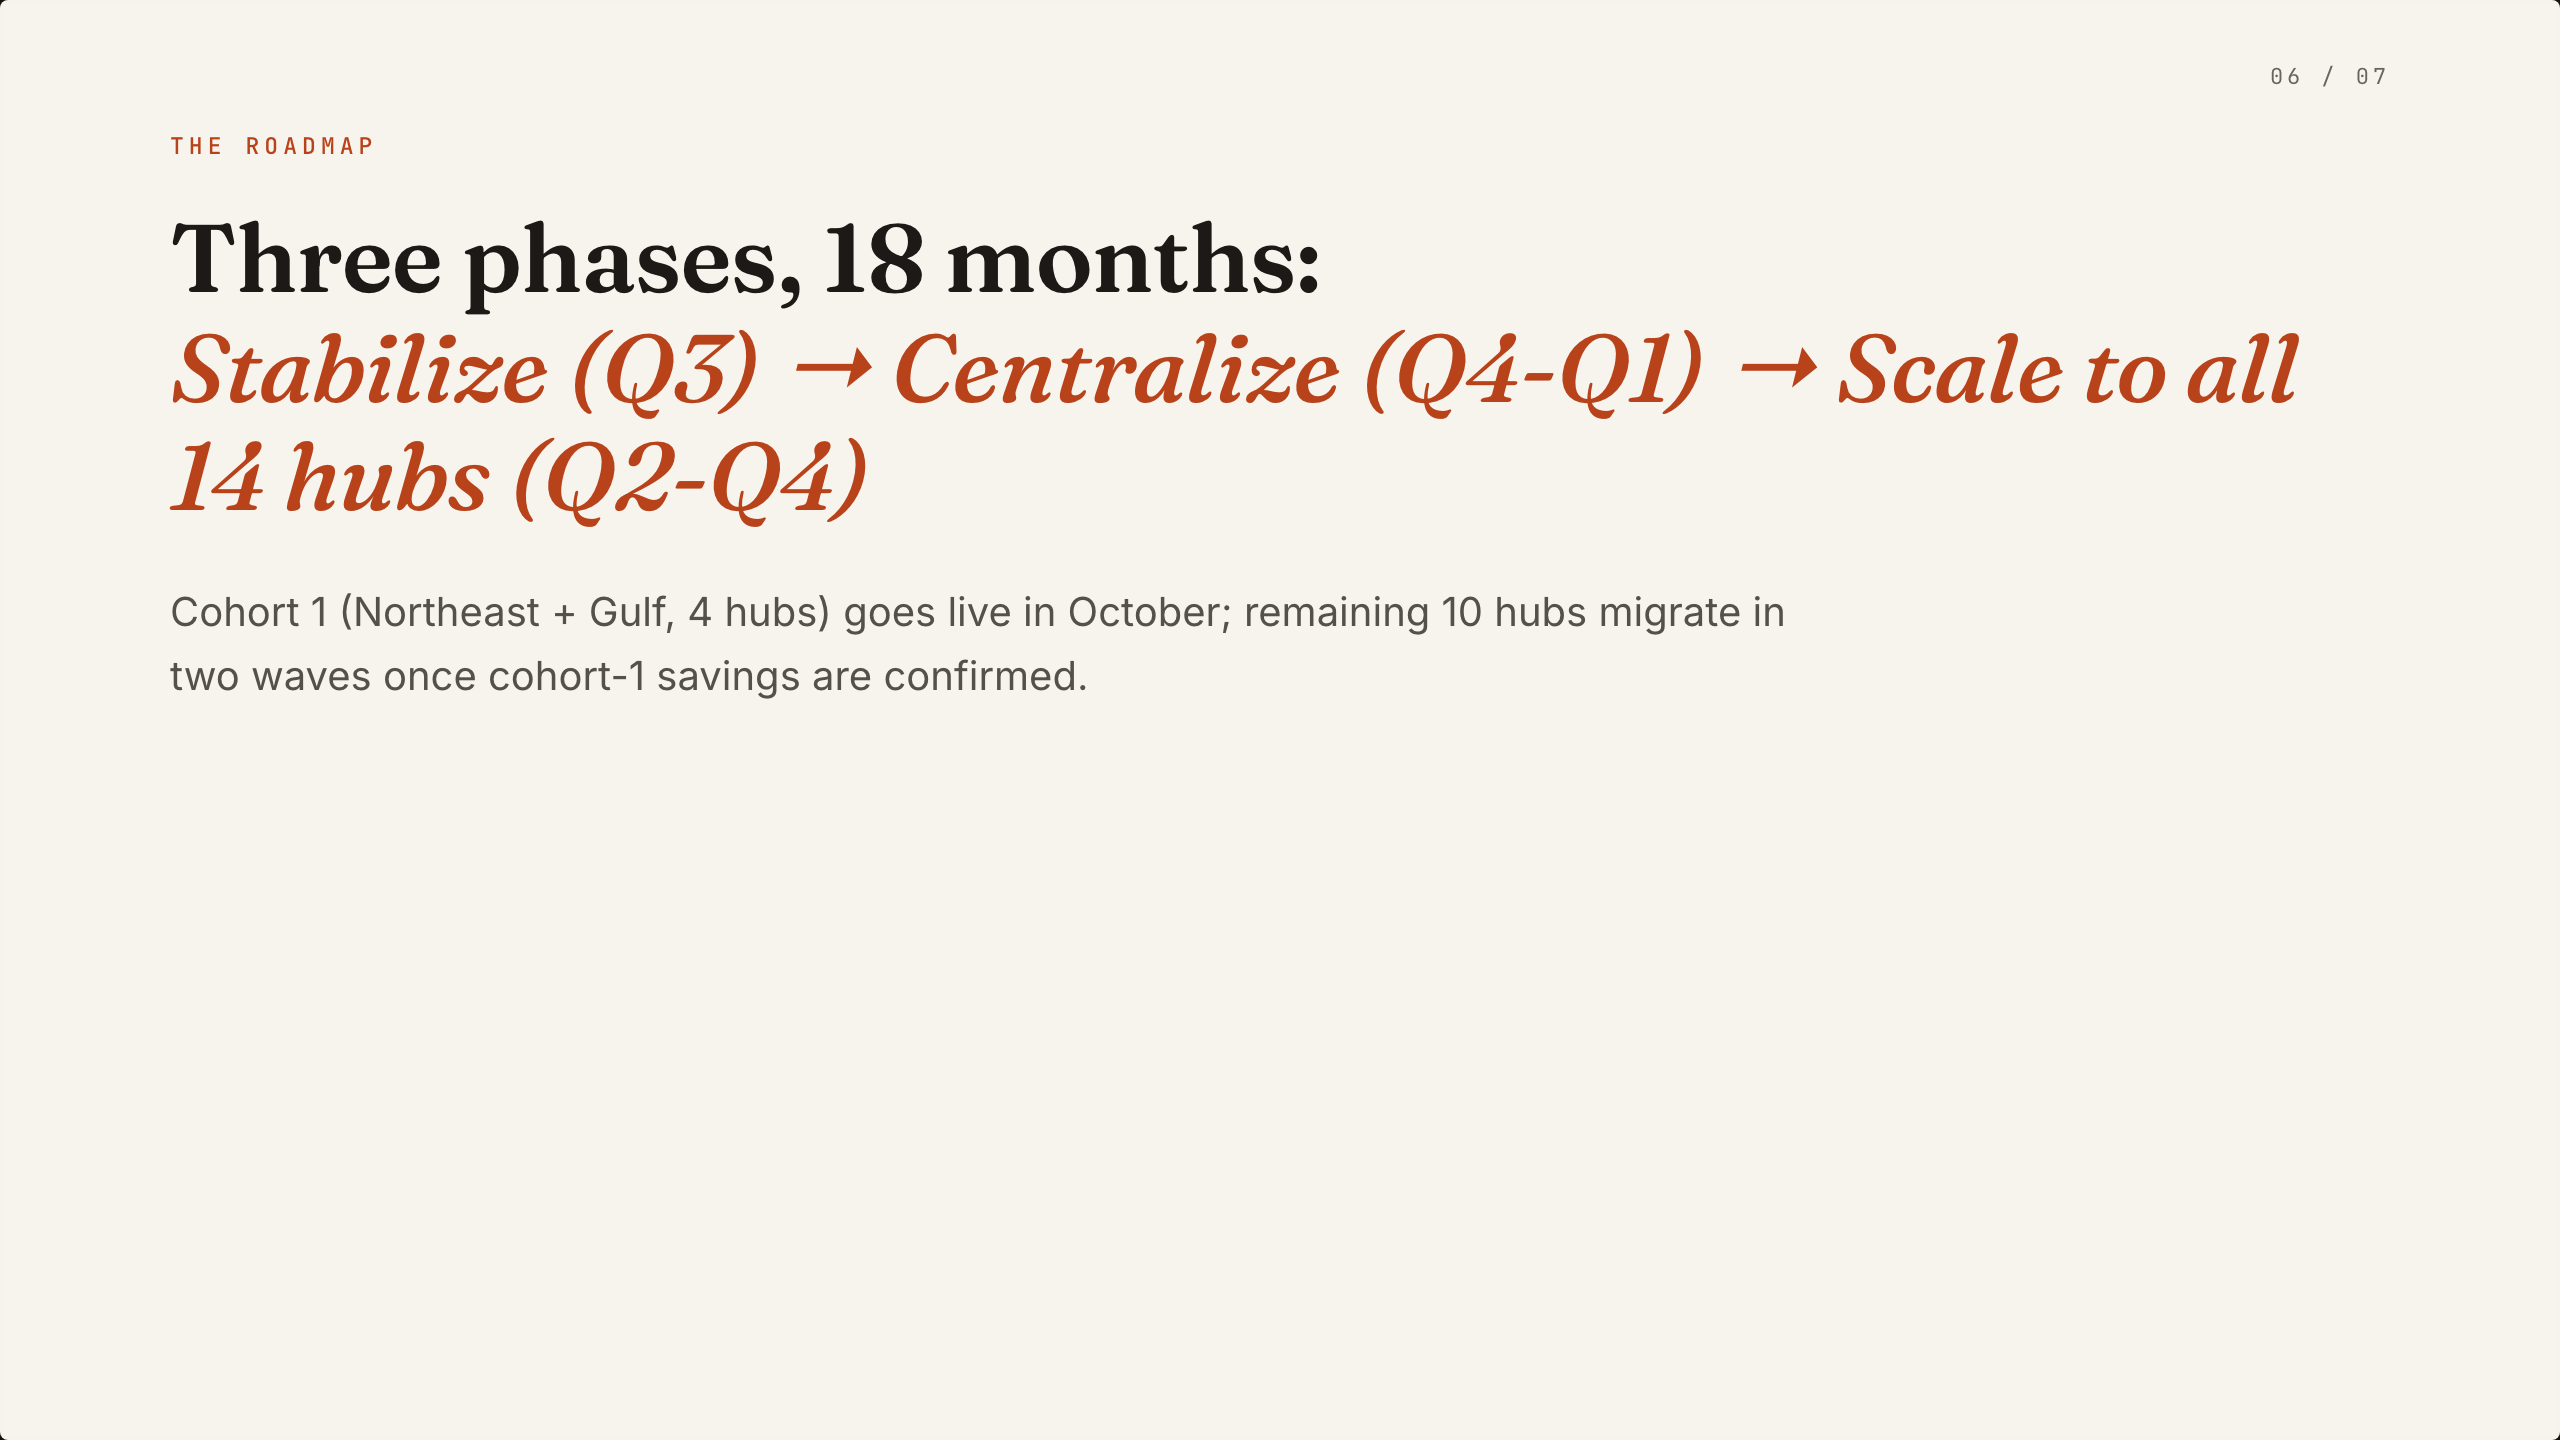
The roadmap resolves the recommendation into action. Stabilize runs in Q3, Centralize spans Q4–Q1, and Scale covers Q2–Q4 within the stated 18-month plan. Cohort 1 covers the Northeast and Gulf across four hubs before the remaining 10 migrate in two waves. The final dark slide changes the visual state and compresses the narrative into a Friday steering-committee decision.
Diagnose The Gap
Start with the 9% volume versus 34% cost-to-serve contrast, then support it with the 14-playbook and 6–9-day approval observations.
State The Operating Principle
Use the centralize-planning, regionalize-execution sentence as the bridge between symptoms and the recommended model.
Compare The Paths
Give each option a distinct downside so the recommendation reads as a considered tradeoff, not a predetermined answer.
Close With A Decision
End with the selected option, accountable transition owner, funding tranche, and decision timing.
Illustrative Strategy Content
This is a seven-slide HTML presentation with vertically stacked sections. The source handles Left and Right arrow keys by scrolling to a selected slide, and ordinary page scrolling remains available. That local navigation does not establish a PPTX export, connected service, editable business model, or stored workflow. Names, percentages, dollar amounts, hub counts, payback, and board requests are illustrative content for the Meridian Freight scenario.
The design demonstrates composition, ordering, comparison, and visual emphasis. It does not independently verify the claimed operating performance or prove that the proposed model was implemented. The declared license belongs to the bundled plugin manifest and does not establish separate licensing for every depicted asset.
How to Create Operating Model Presentation Design in OpenDesign
Set The Decision Spine
Define a seven-part narrative around diagnosis, governing thought, options, value, roadmap, and ask. Keep the title short and use a subtitle to state the operating-model problem.
Suggested PromptCreate a seven-slide operating model presentation for a fictional freight company. Use a restrained editorial consulting layout with a diagnosis comparing volume growth and cost-to-serve, a centralize-planning and regionalize-execution principle, three options, illustrative value measures, an 18-month hub-cohort roadmap, and a final decision request. Treat all figures as illustrative and do not imply live services or verified outcomes.
Refine The Comparison
Keep the three options in the same visual structure, but give each one a distinct consequence. Make the recommended path identifiable through wording and tradeoff, not decorative emphasis alone.
Check The Transition Logic
Review that the value slide follows the recommendation, that the roadmap names Stabilize, Centralize, and Scale, and that the final ask repeats the owner, tranche, and decision timing without adding unsupported claims.
Export and Get a Share Link
Export your finished design, then use Share in OpenDesign to get a share link. Open the link in a separate browser window and check that the intended version and its assets are available before sending it.
Brand Story Presentation Design
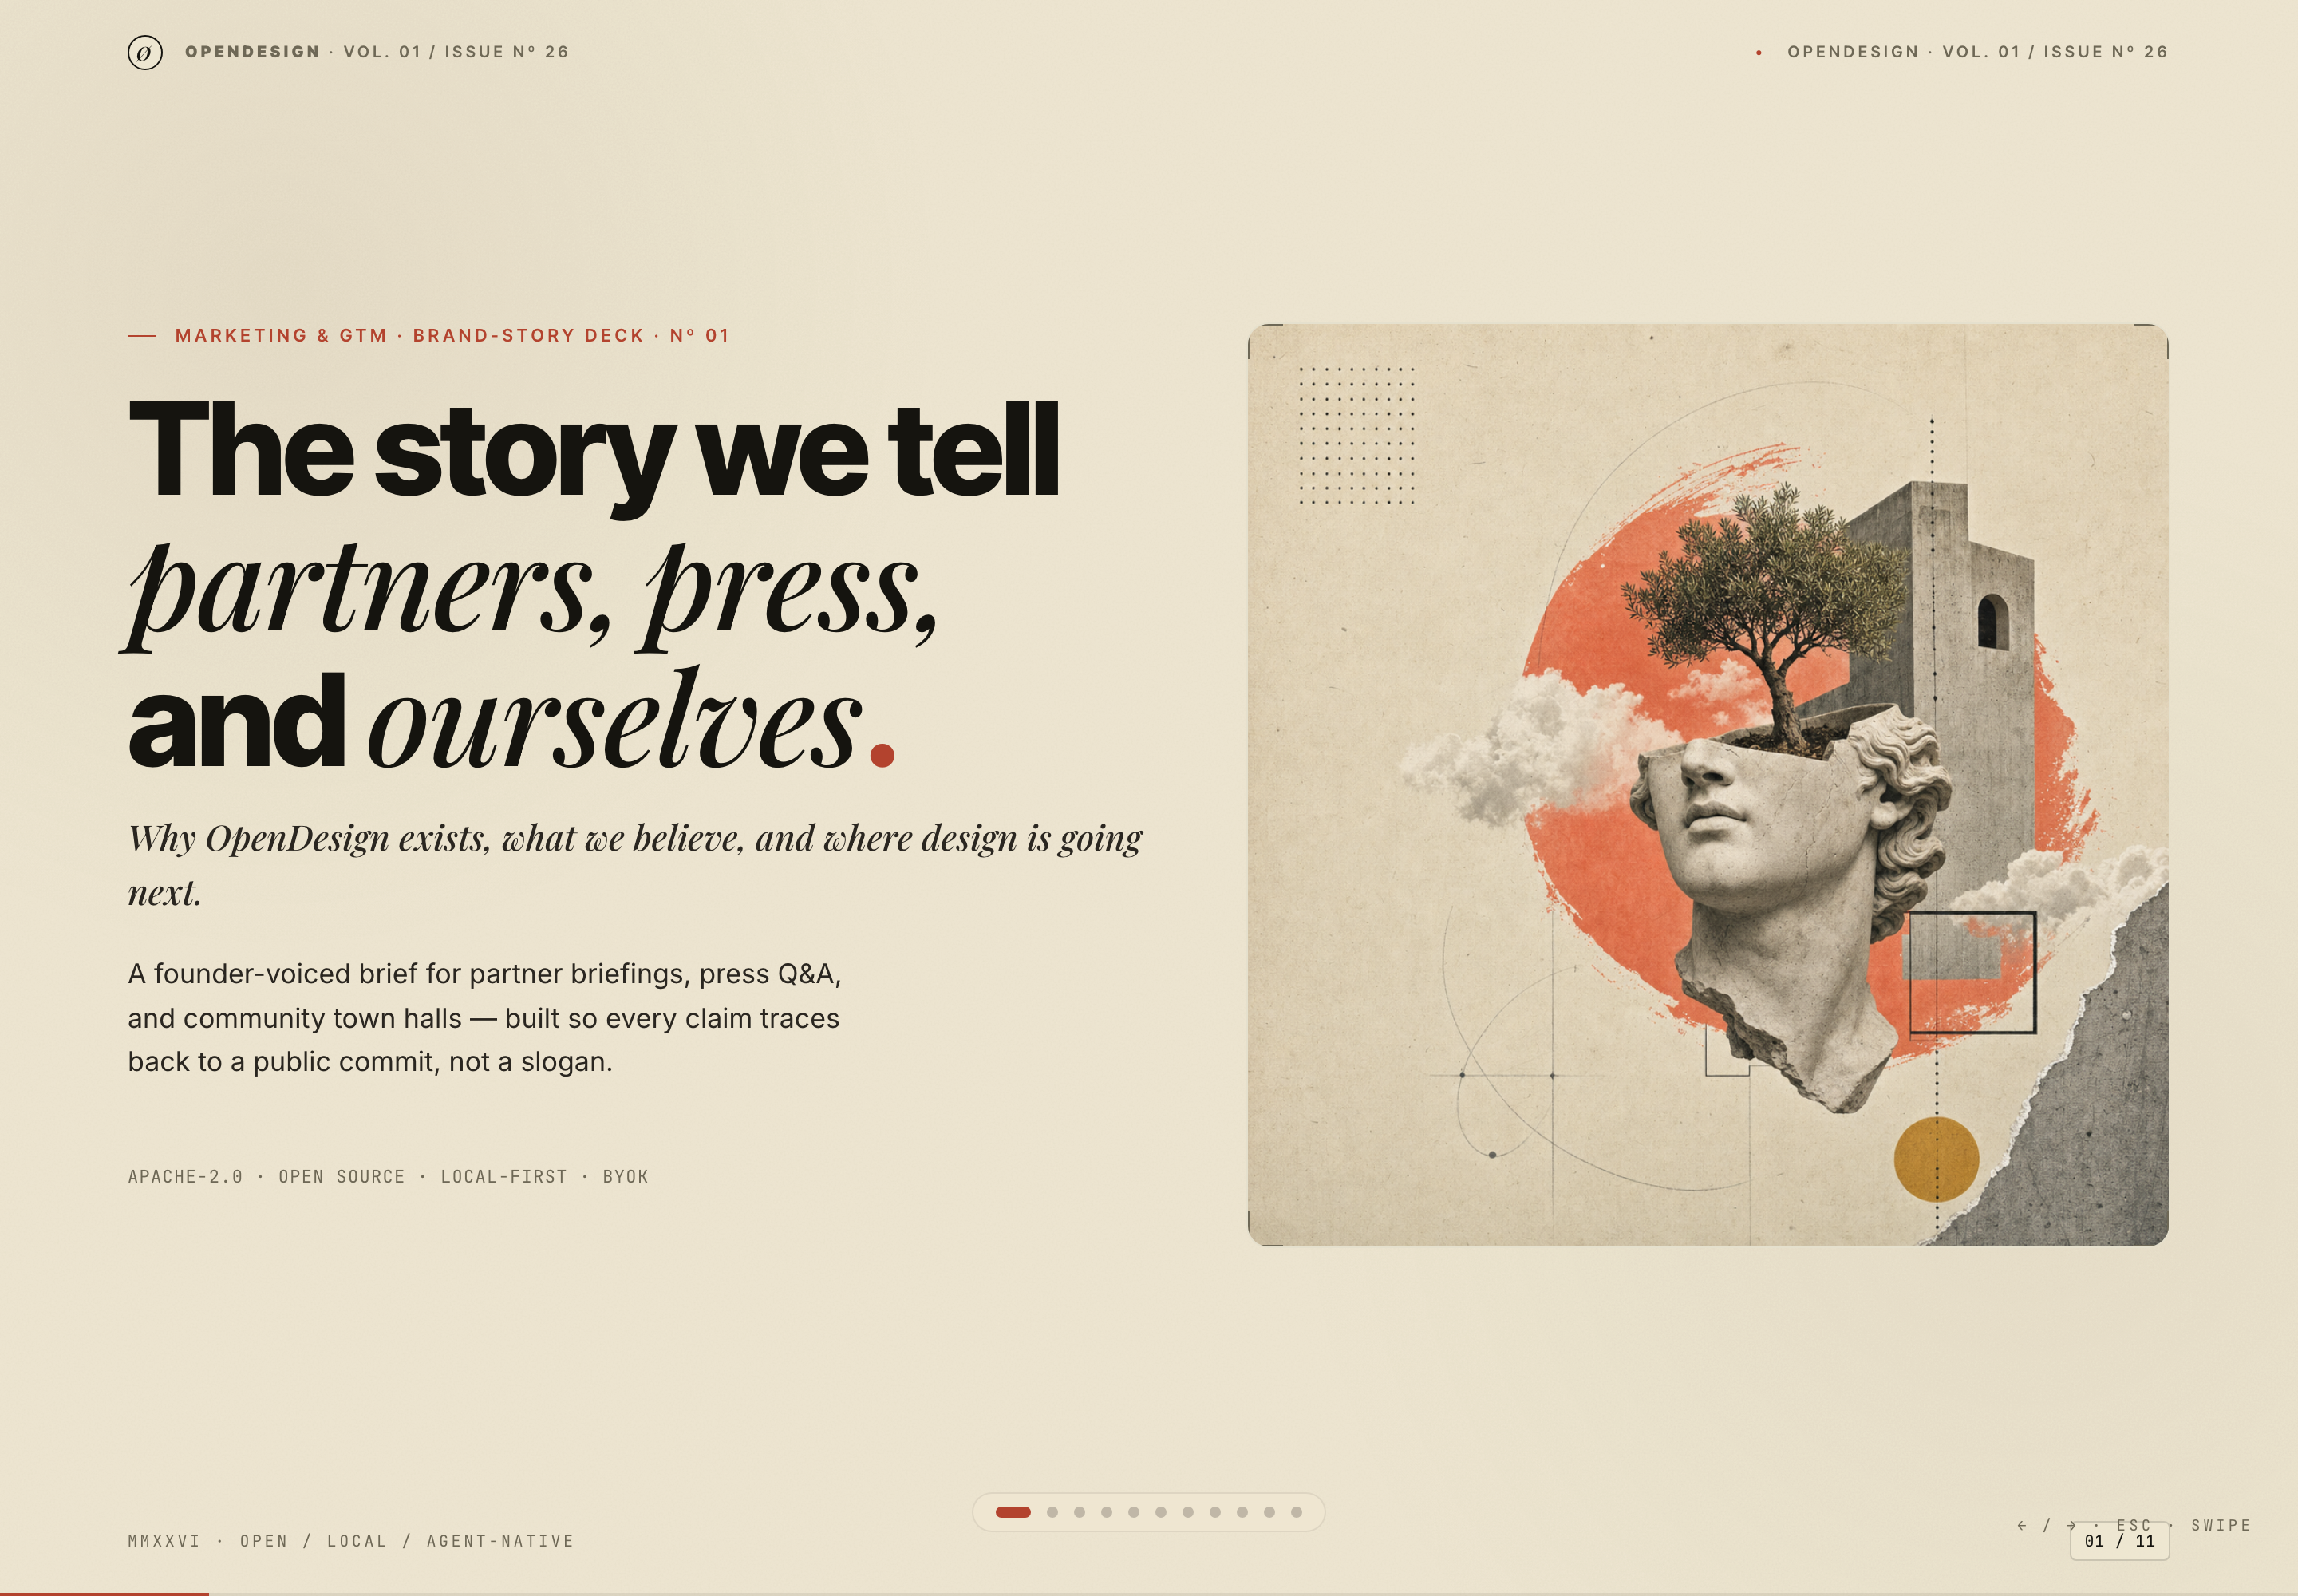
Brand Story Presentation Design gives partners, press, and community audiences one evidence-led narrative from belief to channels, calendar, and verification.
Slides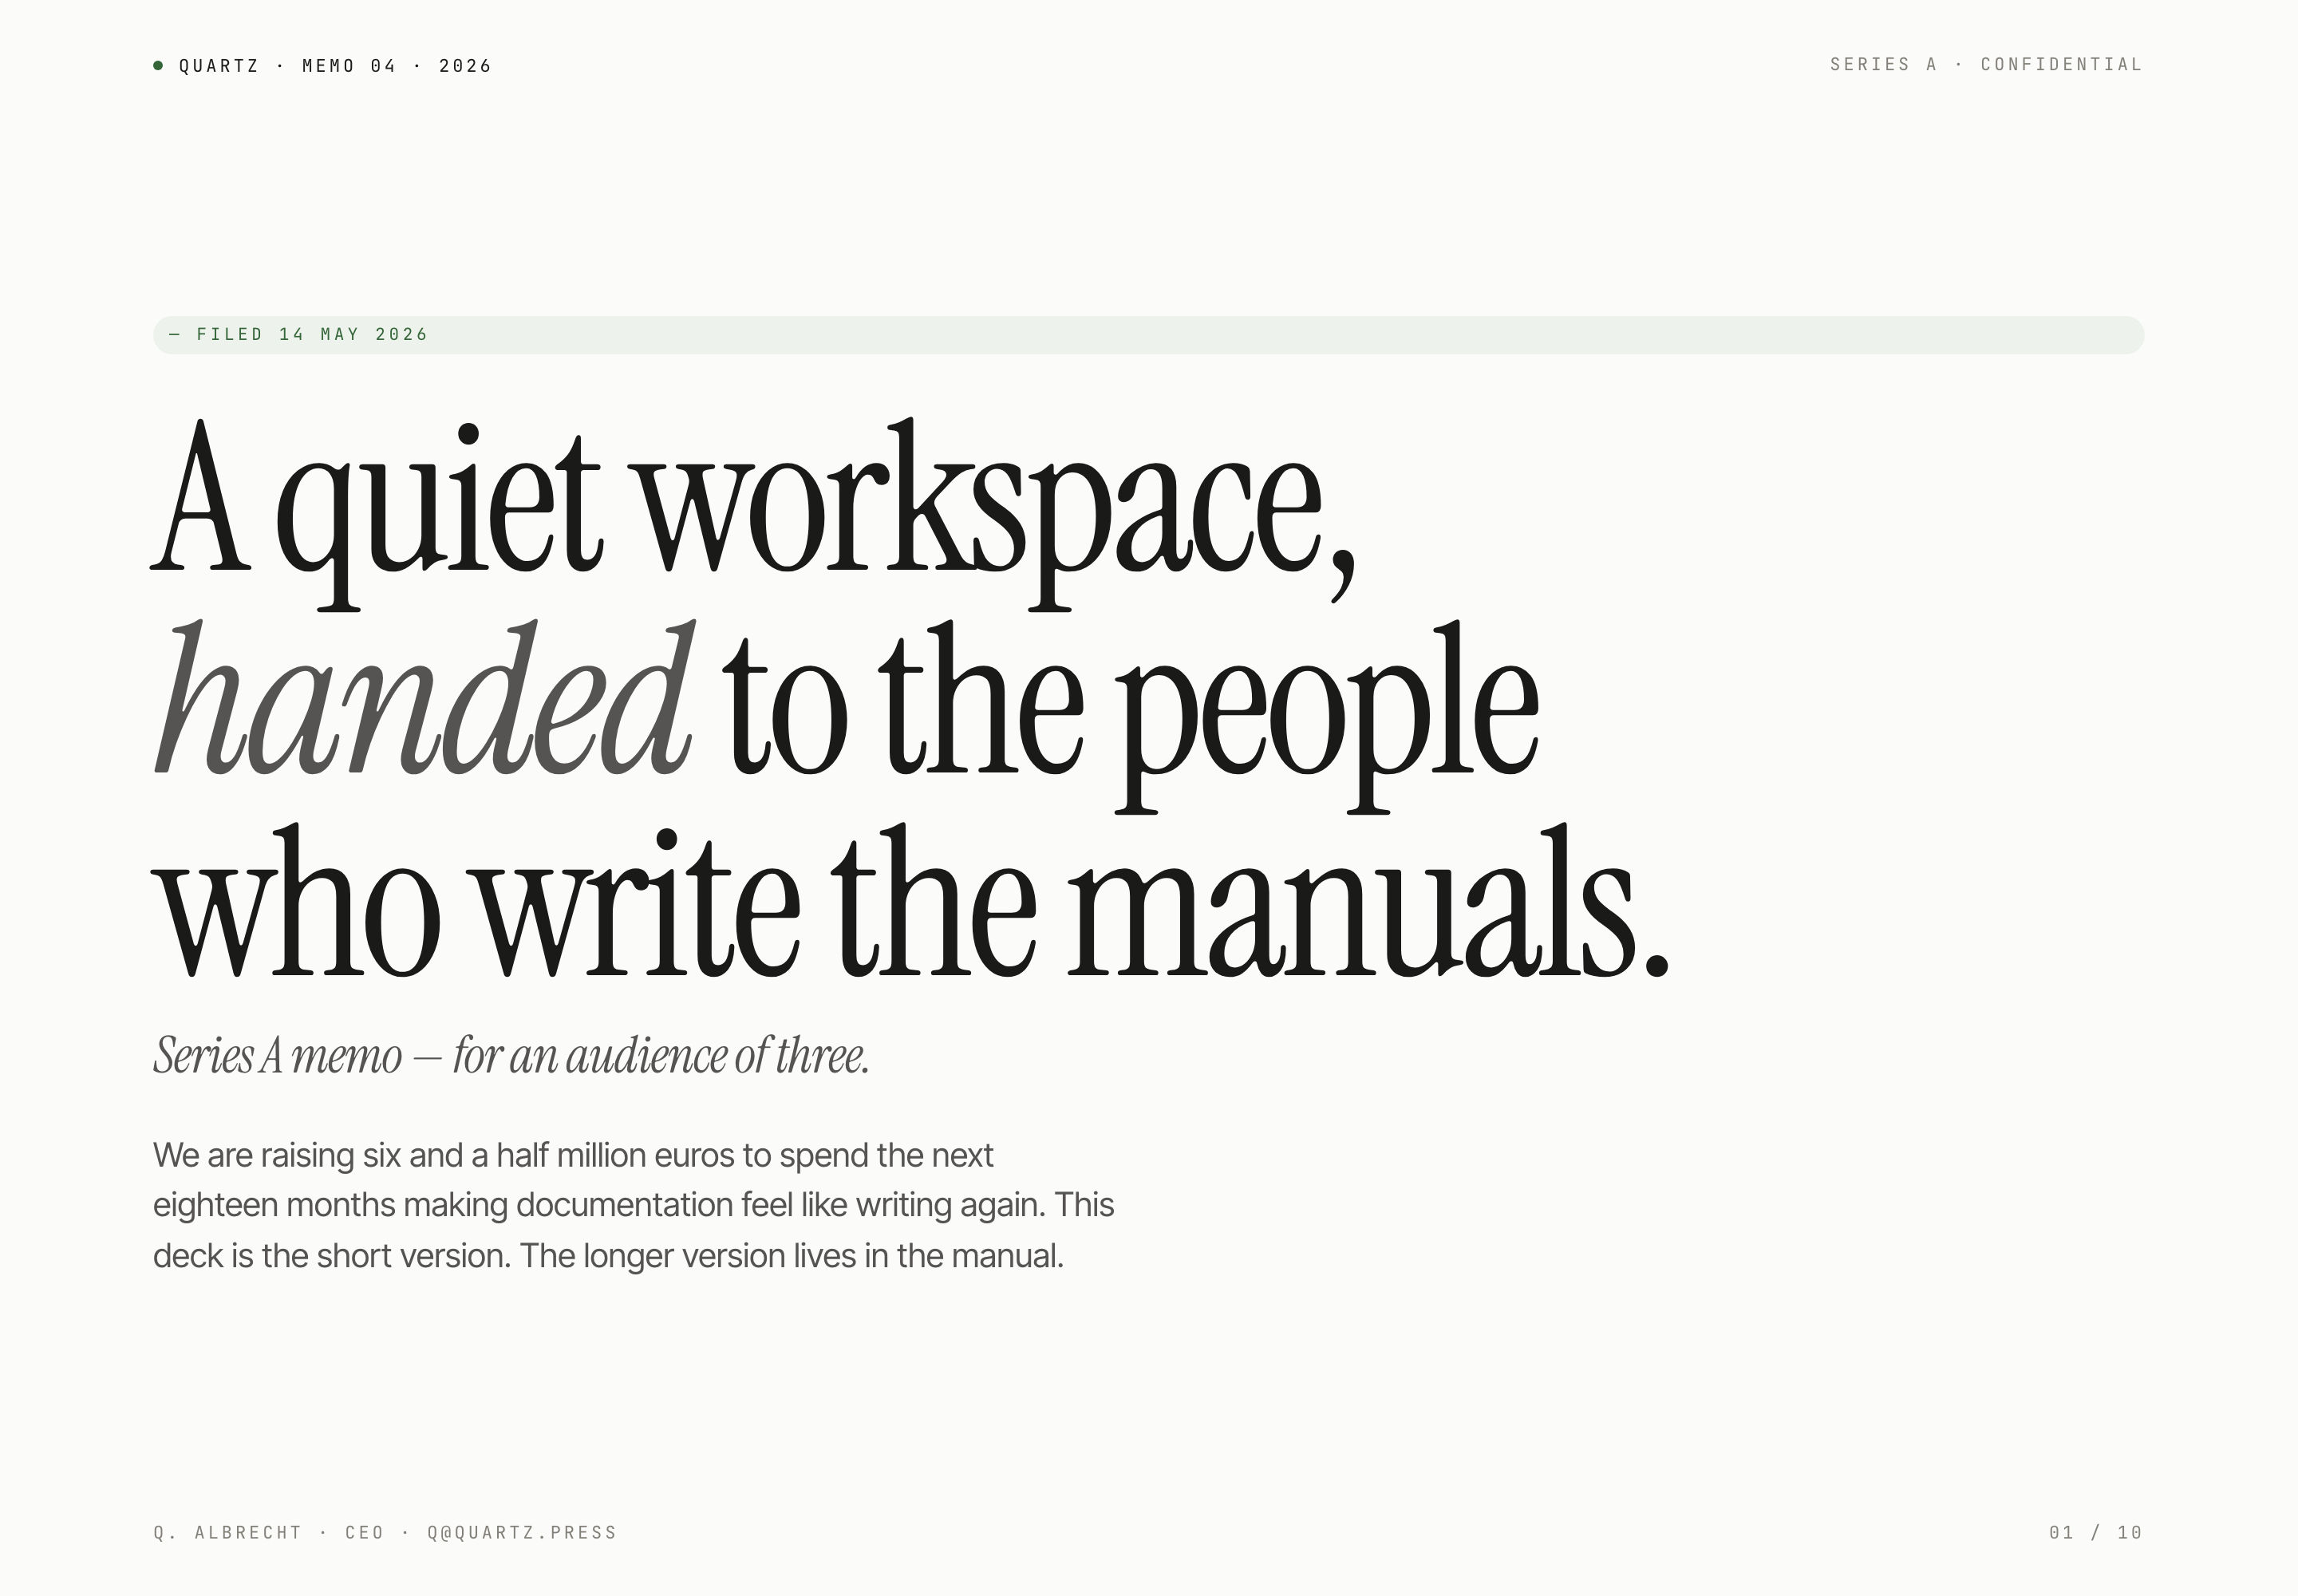
Fundraising Memo Presentation Design
Quartz's ten-slide fundraising memo pairs quiet serif typography with product principles, sample traction, and a funding request for a small investor audience.
Slides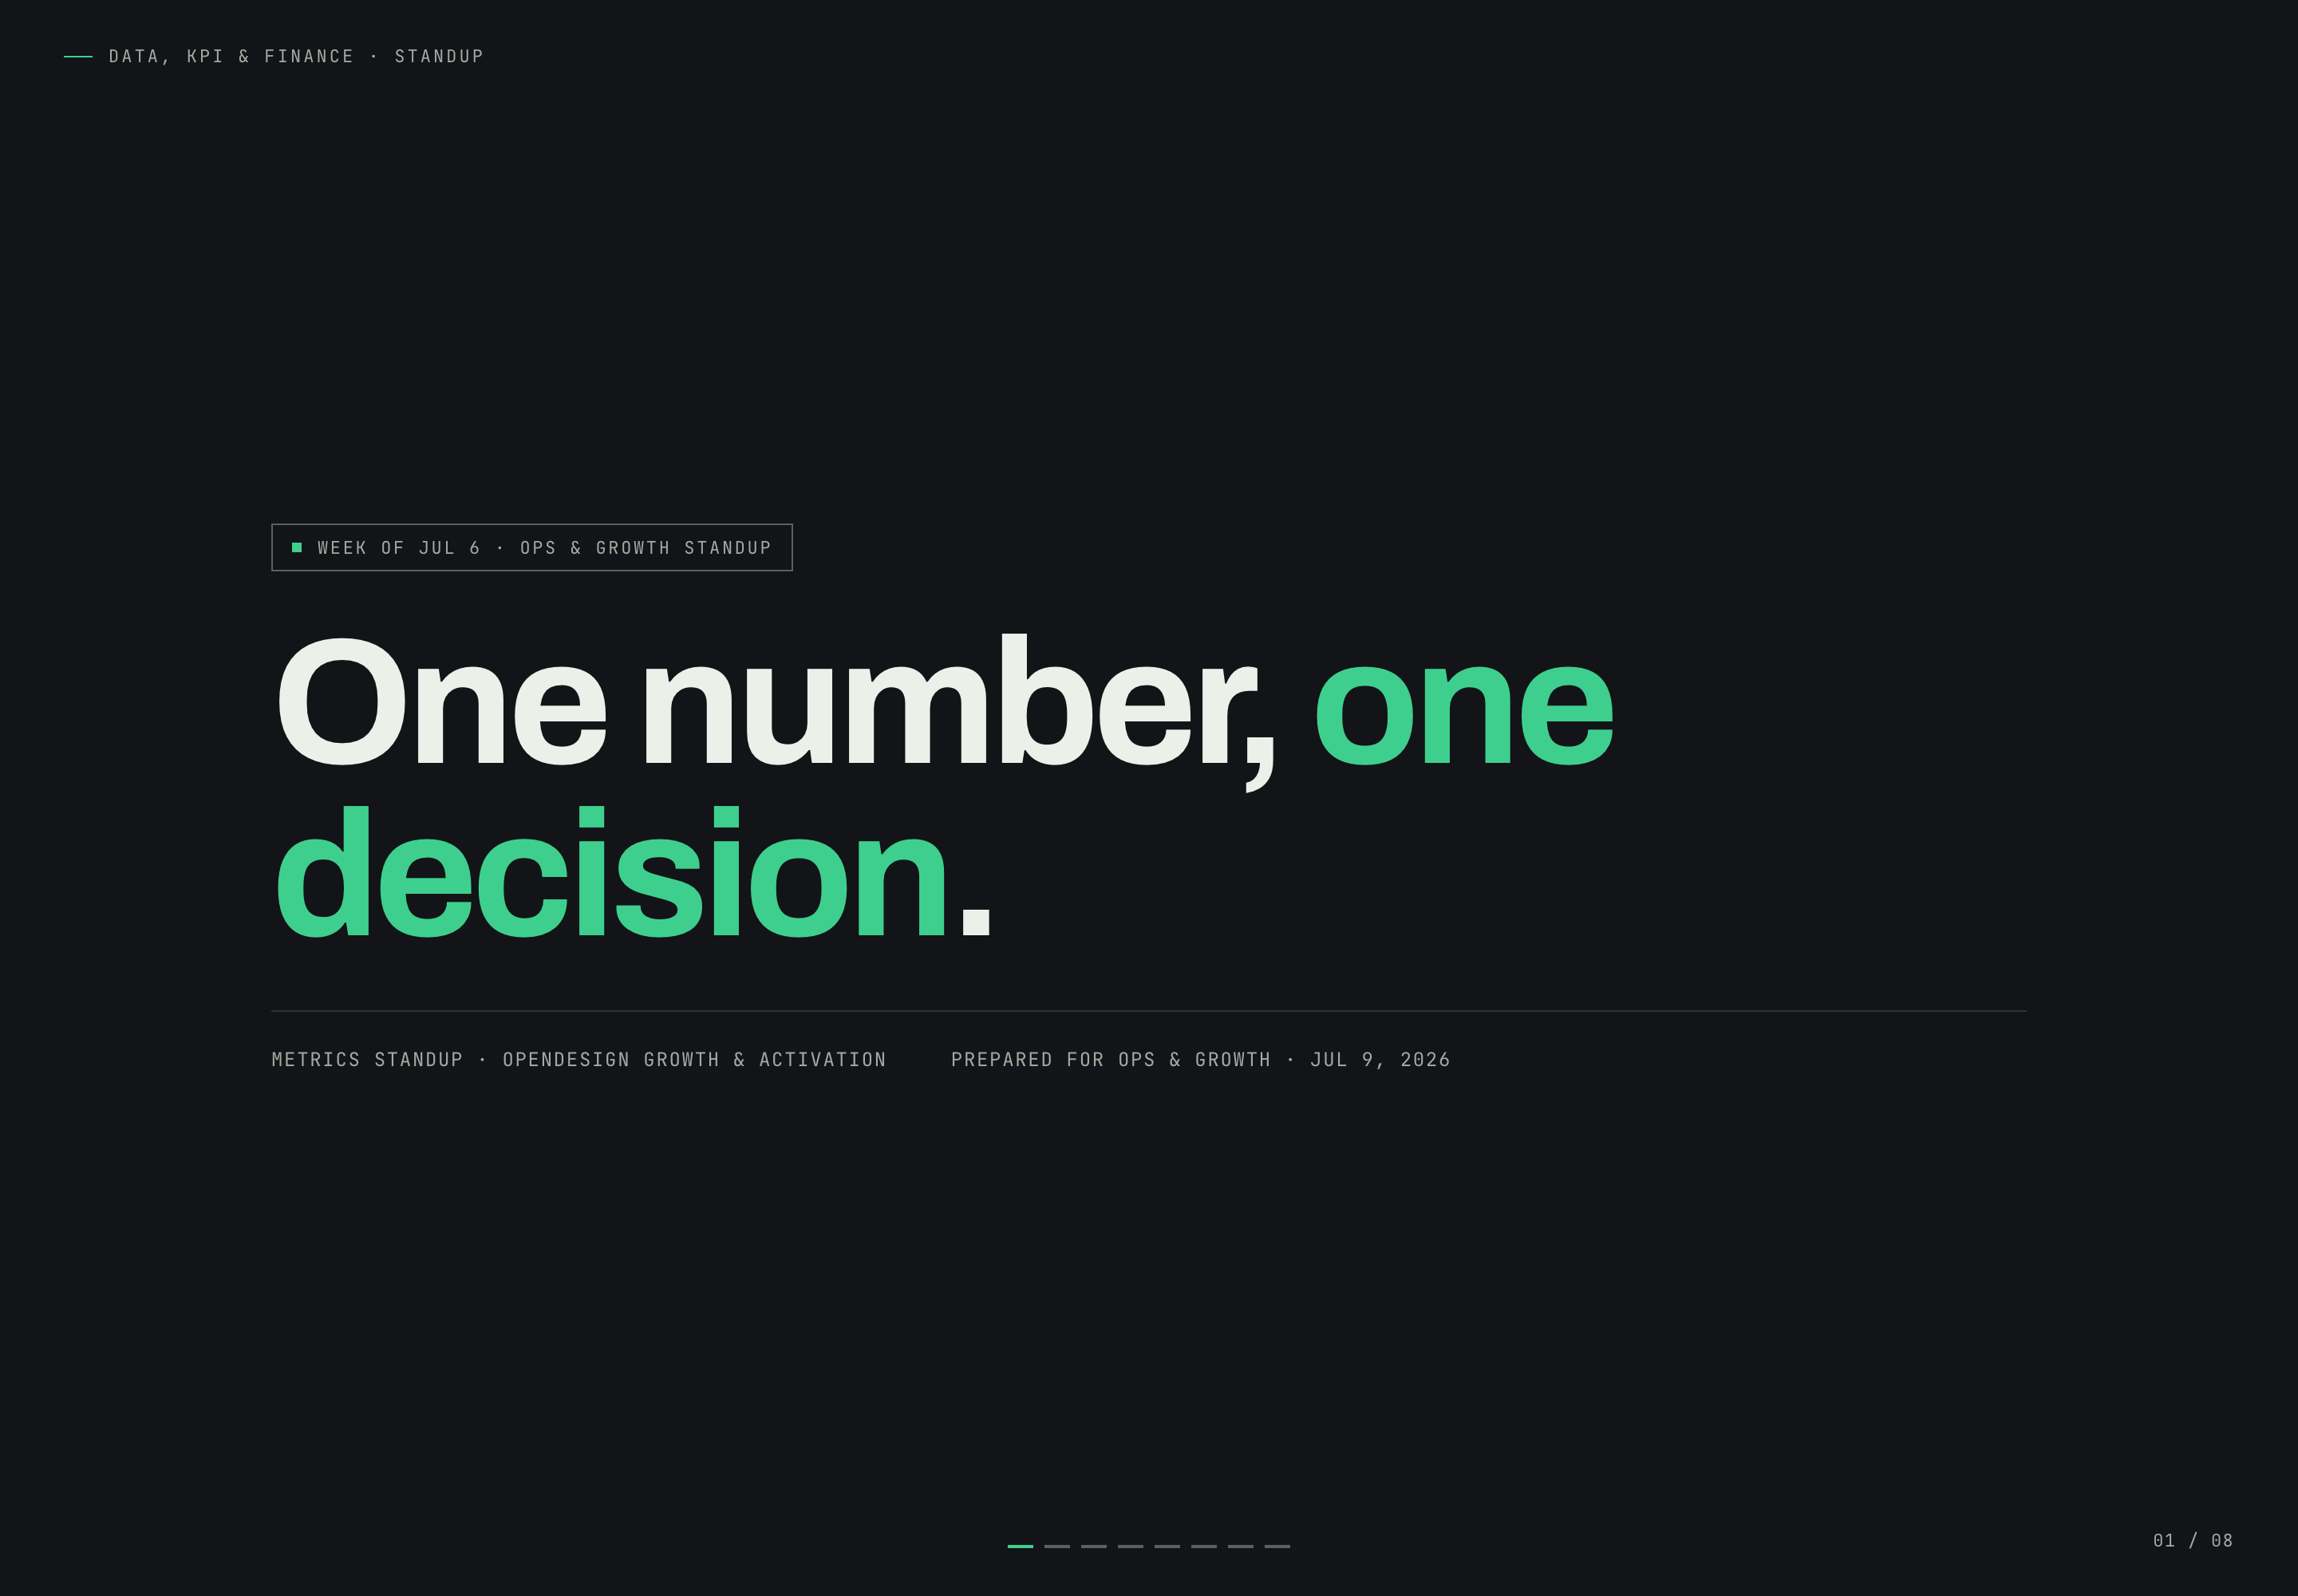
Growth Metrics Standup Design
Growth Metrics Standup Presentation Design turns a Safari conversion problem into a focused narrative that ends with one owned decision.
Slides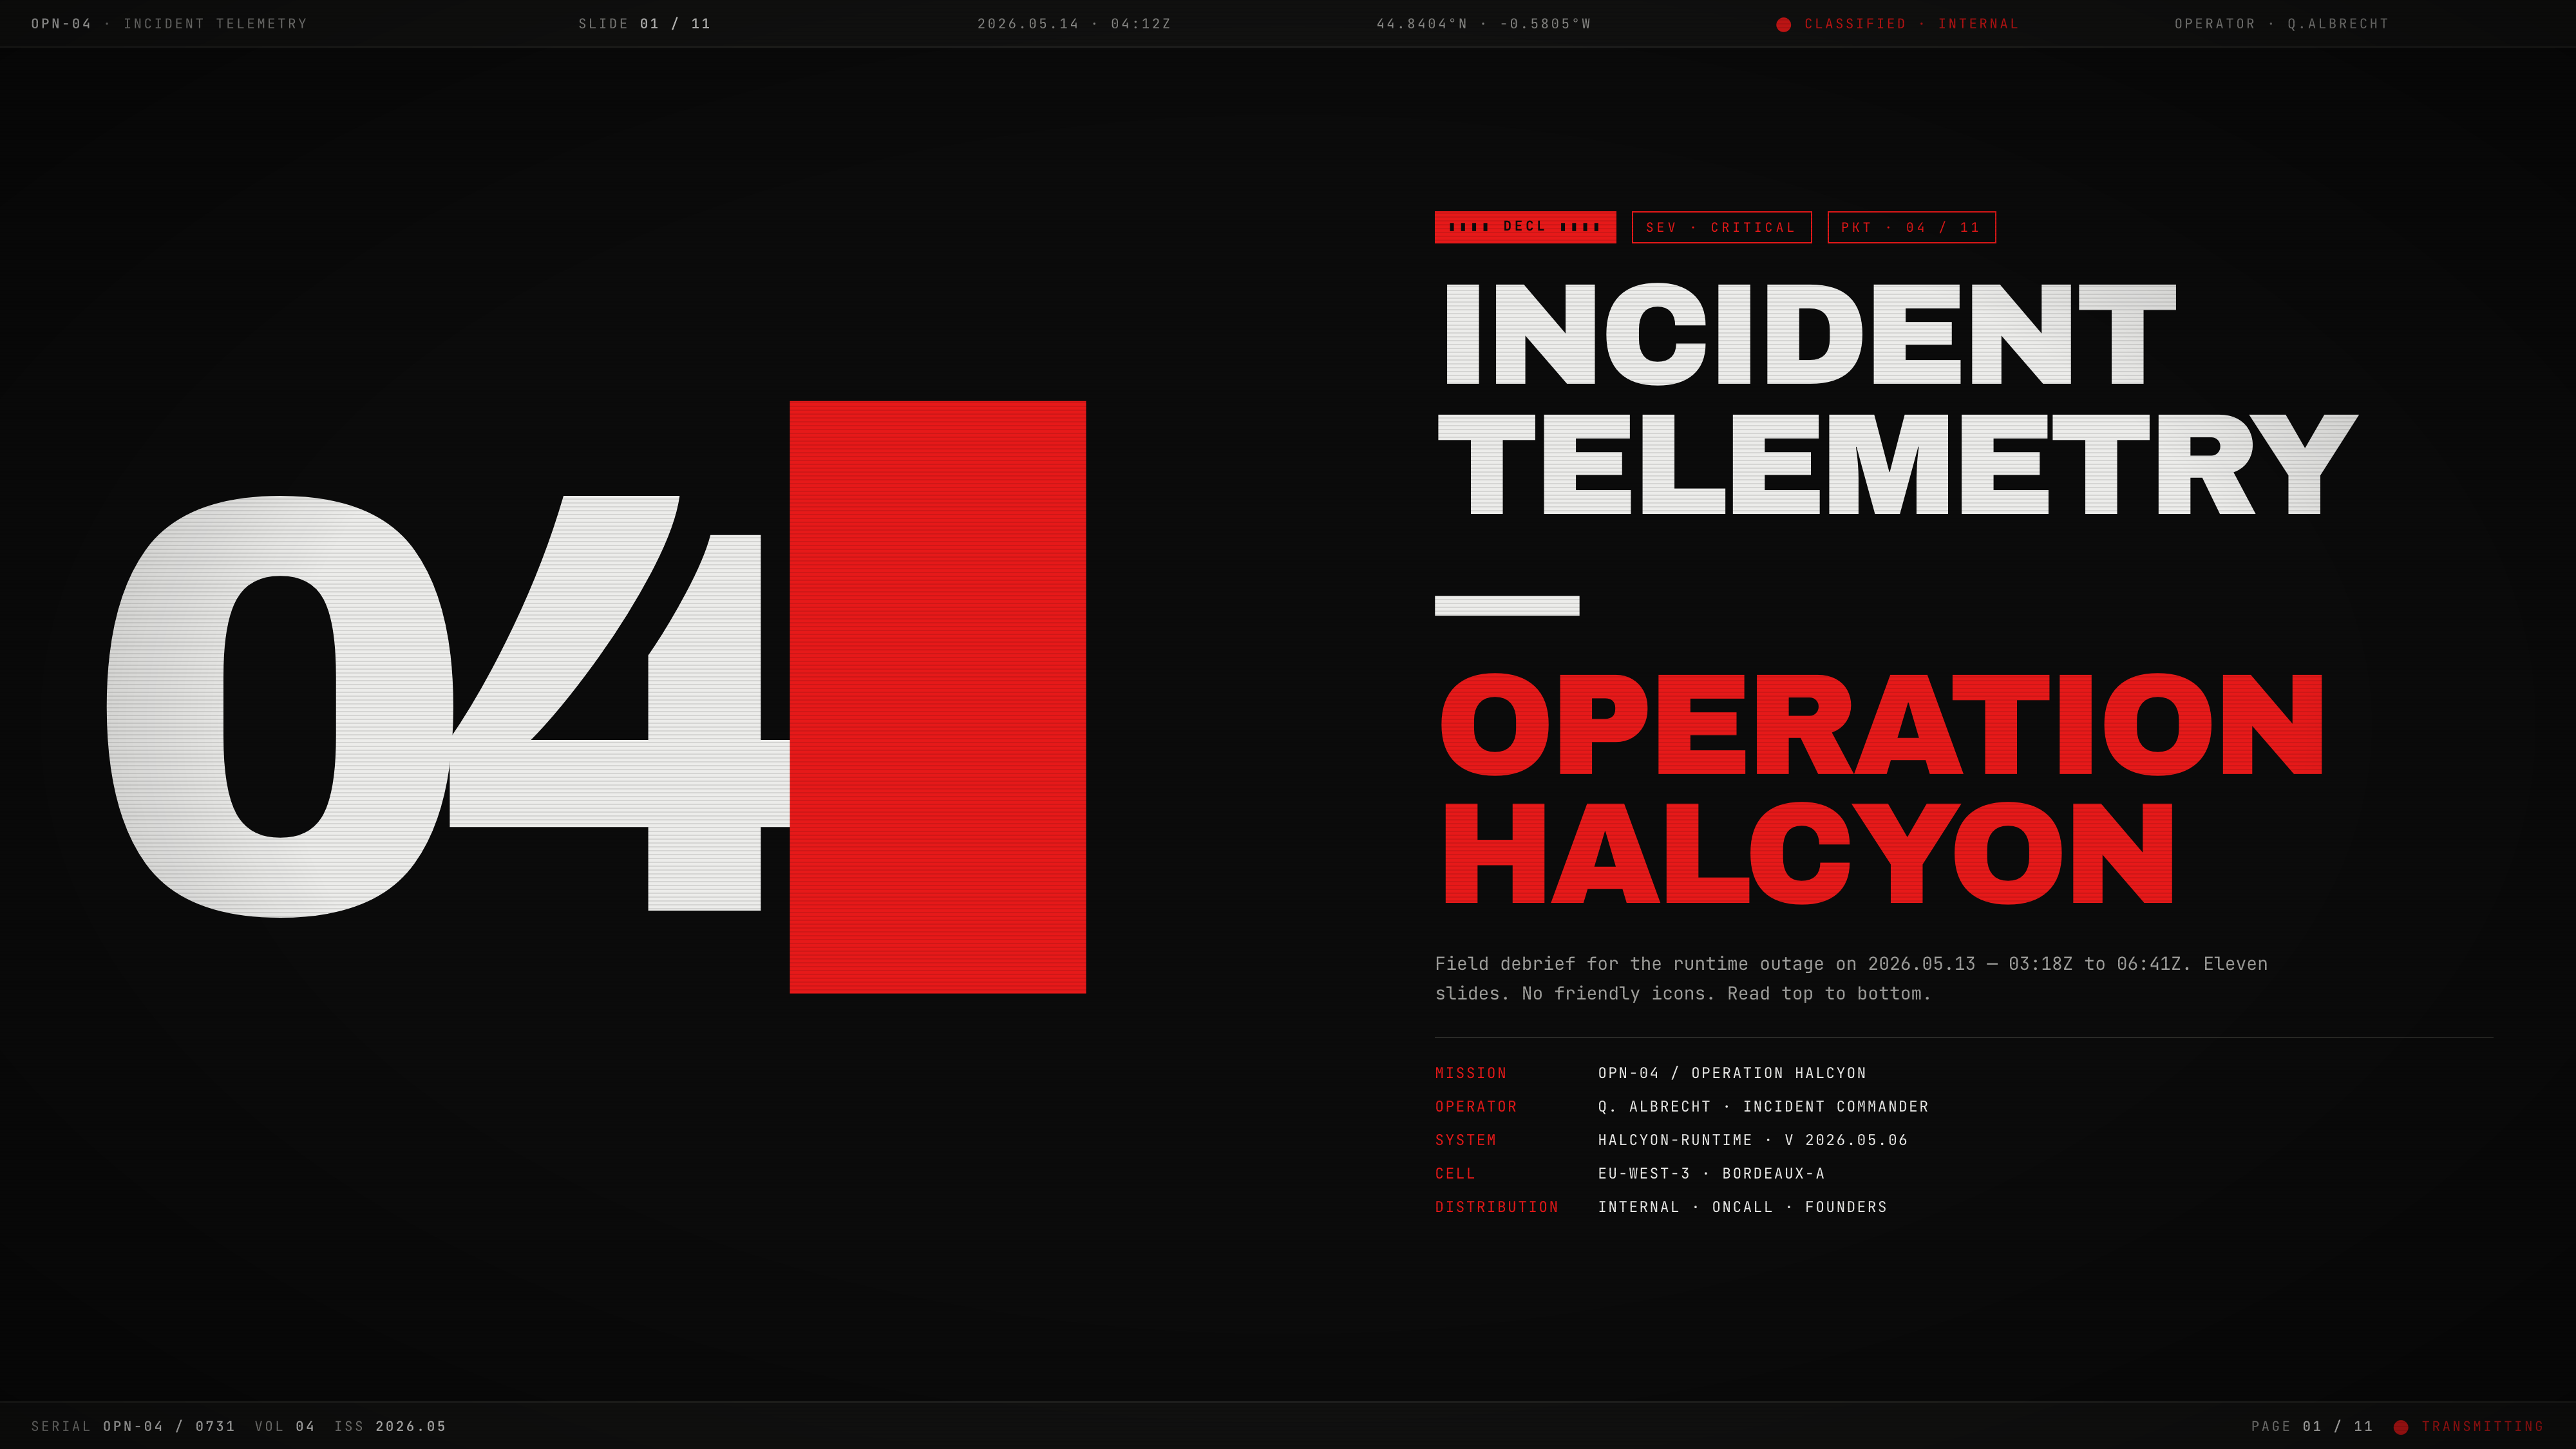
Incident Telemetry Presentation Design
Incident Telemetry — Operation Halcyon turns an illustrative runtime outage into an ordered briefing for tracing causes, risks, and decisions.
Slides