

How to Create an AI-Powered PPT with OpenDesign: A Hands-on Workshop Tutorial
A copy-ready written workshop guide for using OpenDesign to turn raw notes into an editable AI-powered PPT, from visual direction and deck mode through assets, charts, motion, and final QA.
Core idea: split AI deck creation into controlled steps: choose a style, build an editable deck, then refine it with assets, charts, motion, and comments.
Before You Start
You can use this workflow for a research report, product pitch, lecture, portfolio presentation, internal strategy memo, event recap, or any other material that needs to become a visual deck. The source material can be one document, several notes, a transcript, a research summary, or even a messy collection of bullet points.
Recommended setup: OpenDesign installed locally, one connected coding agent or AI agent, and a source document that contains the topic, audience, purpose, and raw content. If your agent can browse, download assets, generate images, and edit code, the workflow becomes much smoother.
Define the Presentation Purpose First
A presentation is not just a beautiful set of slides. It should help the audience understand something and make a decision, form a judgment, or take action. Before asking OpenDesign to design anything, write down what the audience should understand and what conclusion they should reach.
Prompt 0: Clarify the deck purpose before design
I want to create a presentation about [TOPIC].

Audience:
[DESCRIBE THE AUDIENCE]

The presentation should help the audience understand:
1. [WHAT THEY NEED TO UNDERSTAND]
2. [WHAT CONTEXT OR EVIDENCE THEY NEED]

The presentation should lead the audience to this judgment or decision:
[THE DECISION / BELIEF / ACTION YOU WANT]

Please help me clarify:
1. The core narrative of this presentation.
2. The most important argument.
3. The recommended slide order.
4. What information should be shown visually instead of only as text.

Do not design the slides yet. Do not write HTML yet. Focus only on the story, structure, and decision logic.
Step 1: Use Image Mode to Generate One Reference Image with Multiple Styles
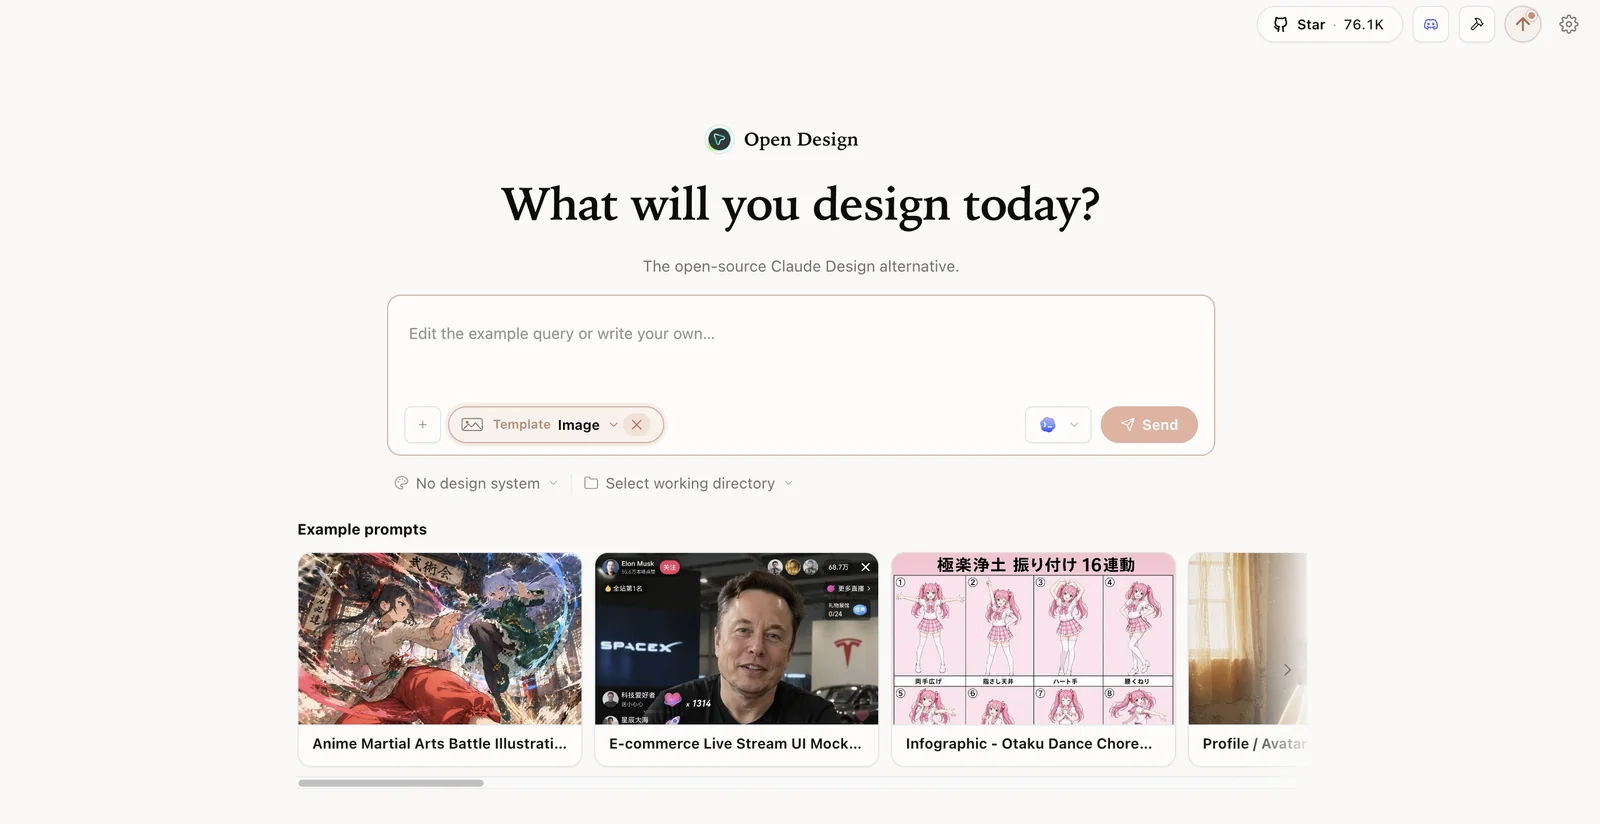
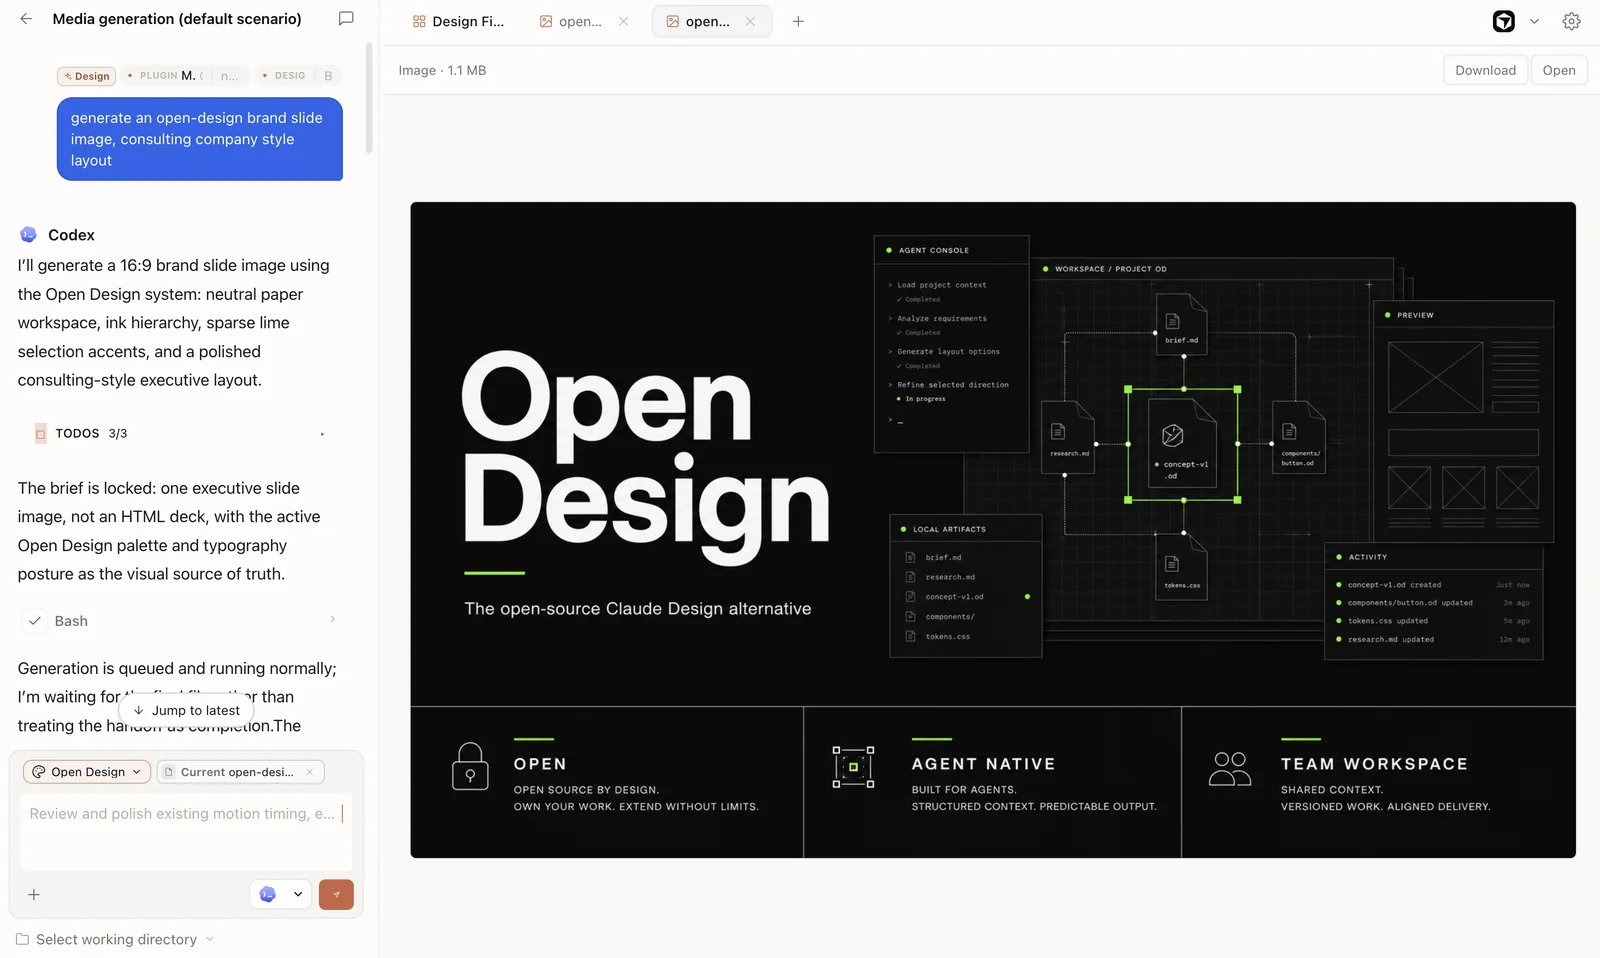
The first OpenDesign step is not to generate the full PPT. Instead, use Image Mode to generate one reference image that contains several possible visual directions. This gives the user a choice before committing to a deck style. This matters because people often do not know the exact name of the style they want. They may not know whether they prefer Swiss typography, brutalist layouts, cyberpunk dashboards, editorial magazine design, product launch visuals, or a clean investor-deck style. A multi-style reference image lets the user compare options visually and choose the style that best matches the message.
Important: in this step, generate only one image. The image should present multiple style options side by side. Do not ask OpenDesign to create the full deck yet.
Prompt 1: Image Mode - generate one image with multiple PPT style options
I am preparing a presentation about [TOPIC].

The audience is:
[AUDIENCE]

The goal of the presentation is:
[GOAL / DECISION / MAIN ARGUMENT]

Please generate ONE single reference image that shows multiple possible visual styles for this PPT.

Requirements:
1. The image should contain 4 to 6 distinct style directions in one composition.
2. Each style direction should look like the cover slide or key visual of the same presentation.
3. The styles should be genuinely different in layout, typography, color, texture, and visual language.
4. Do not create the full PPT yet.
5. Do not make separate images. Put all style options into one image so I can compare them.
6. Each option should have a short style label, such as Swiss editorial, neo-brutalist, glassmorphism, cinematic technology, data magazine, or product launch.

Content to reflect:
[PASTE 5-10 KEY POINTS OR THE DECK OUTLINE]

Make the image useful for choosing the final PPT style.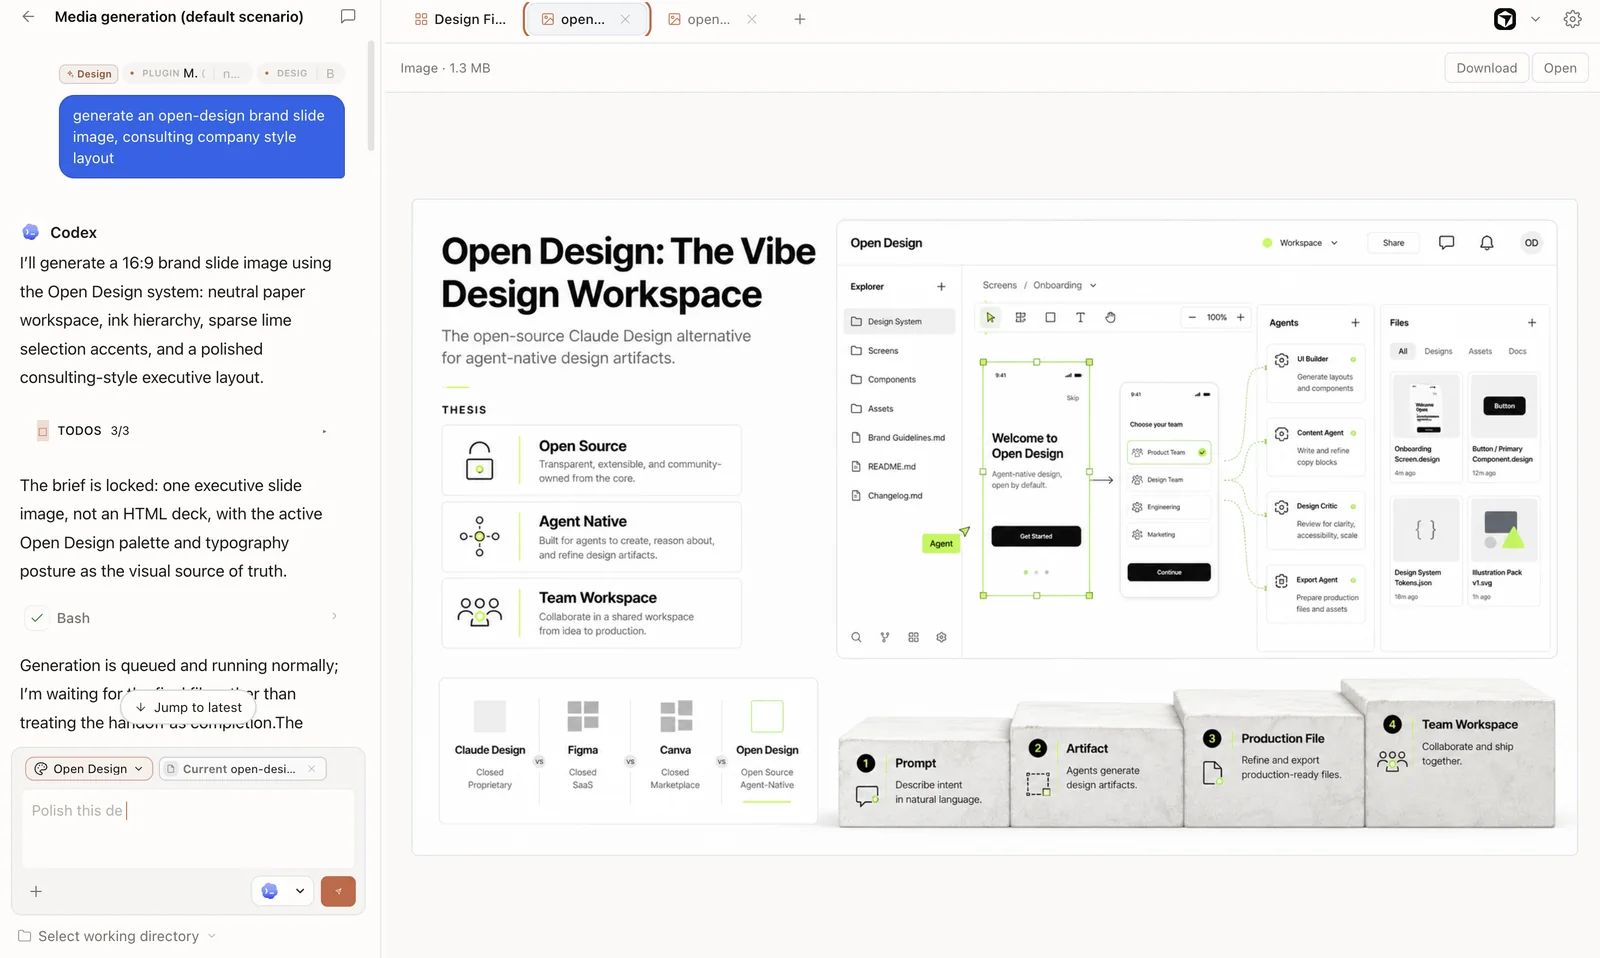
How to Choose the Style
After the image is generated, choose one style direction. Do not only choose the prettiest one. Choose the style that best supports the message. A startup pitch may need clarity and confidence. A research talk may need structure and data density. A creative community talk may benefit from stronger visual personality.
| If Your Deck Needs... | Choose a Style That Feels... |
|---|---|
| Trust, strategy, enterprise credibility | Clean, structured, restrained, editorial |
| Energy, community, product momentum | Bold, vivid, high contrast, expressive |
| Technical depth, data, research | Grid-based, modular, information-dense |
| Futuristic AI or developer tooling | Digital, layered, code-inspired, cinematic |
Prompt 1B: Ask AI to help choose the best direction
Here is the reference image with multiple style directions.

My presentation topic is [TOPIC].
My audience is [AUDIENCE].
The conclusion I want the audience to reach is [CONCLUSION].

Please compare the style options and recommend the best one.

Evaluate each option by:
1. Whether it supports the message.
2. Whether it fits the audience.
3. Whether it can scale to a full deck.
4. Whether it leaves enough room for text, charts, screenshots, and logos.

Do not generate the deck yet. Help me choose one style direction and explain why.
Step 2: Prepare the Slide Structure Before Designing
Before going into Deck Mode, define the slide-by-slide content. This is where many AI presentation workflows fail: they try to design too early. If the text, slide order, and narrative logic are still unclear, every later design edit becomes more expensive. The goal here is to create a clean content skeleton: slide title, subtitle, key message, supporting points, and any visual requirement. You can use any AI chat tool for this step, or use OpenDesign chat if that is your preferred workspace.
Prompt 2: Create the slide-by-slide content plan
I want to create a PPT about [TOPIC].

Audience:
[AUDIENCE]

The audience should understand:
[WHAT THEY SHOULD UNDERSTAND]

The audience should conclude or decide:
[WHAT THEY SHOULD BELIEVE / DECIDE / DO]

Source material:
[PASTE RAW NOTES, TRANSCRIPT, REPORT, OR BULLET POINTS]

Please create the slide-by-slide content plan.

Requirements:
1. Do not design the slides yet.
2. Do not write the final HTML yet.
3. Create [NUMBER] slides.
4. For each slide, provide:
   - Slide title
   - One-sentence key message
   - Main bullet points
   - Suggested visual element, if useful
   - Whether the slide needs a chart, logo, image, screenshot, or motion
5. Keep each slide focused on one idea.
6. Avoid putting too much text on each slide.

After the outline, create a simple HTML preview that places the text of each slide into a clean layout so I can review the structure before visual design starts.
Checkpoint: edit the slide structure now. Change titles, remove weak slides, merge repeated points, and clarify the final conclusion before generating the designed deck.
Step 3: Use Deck Mode to Rebuild the Chosen Image Style as an Editable PPT
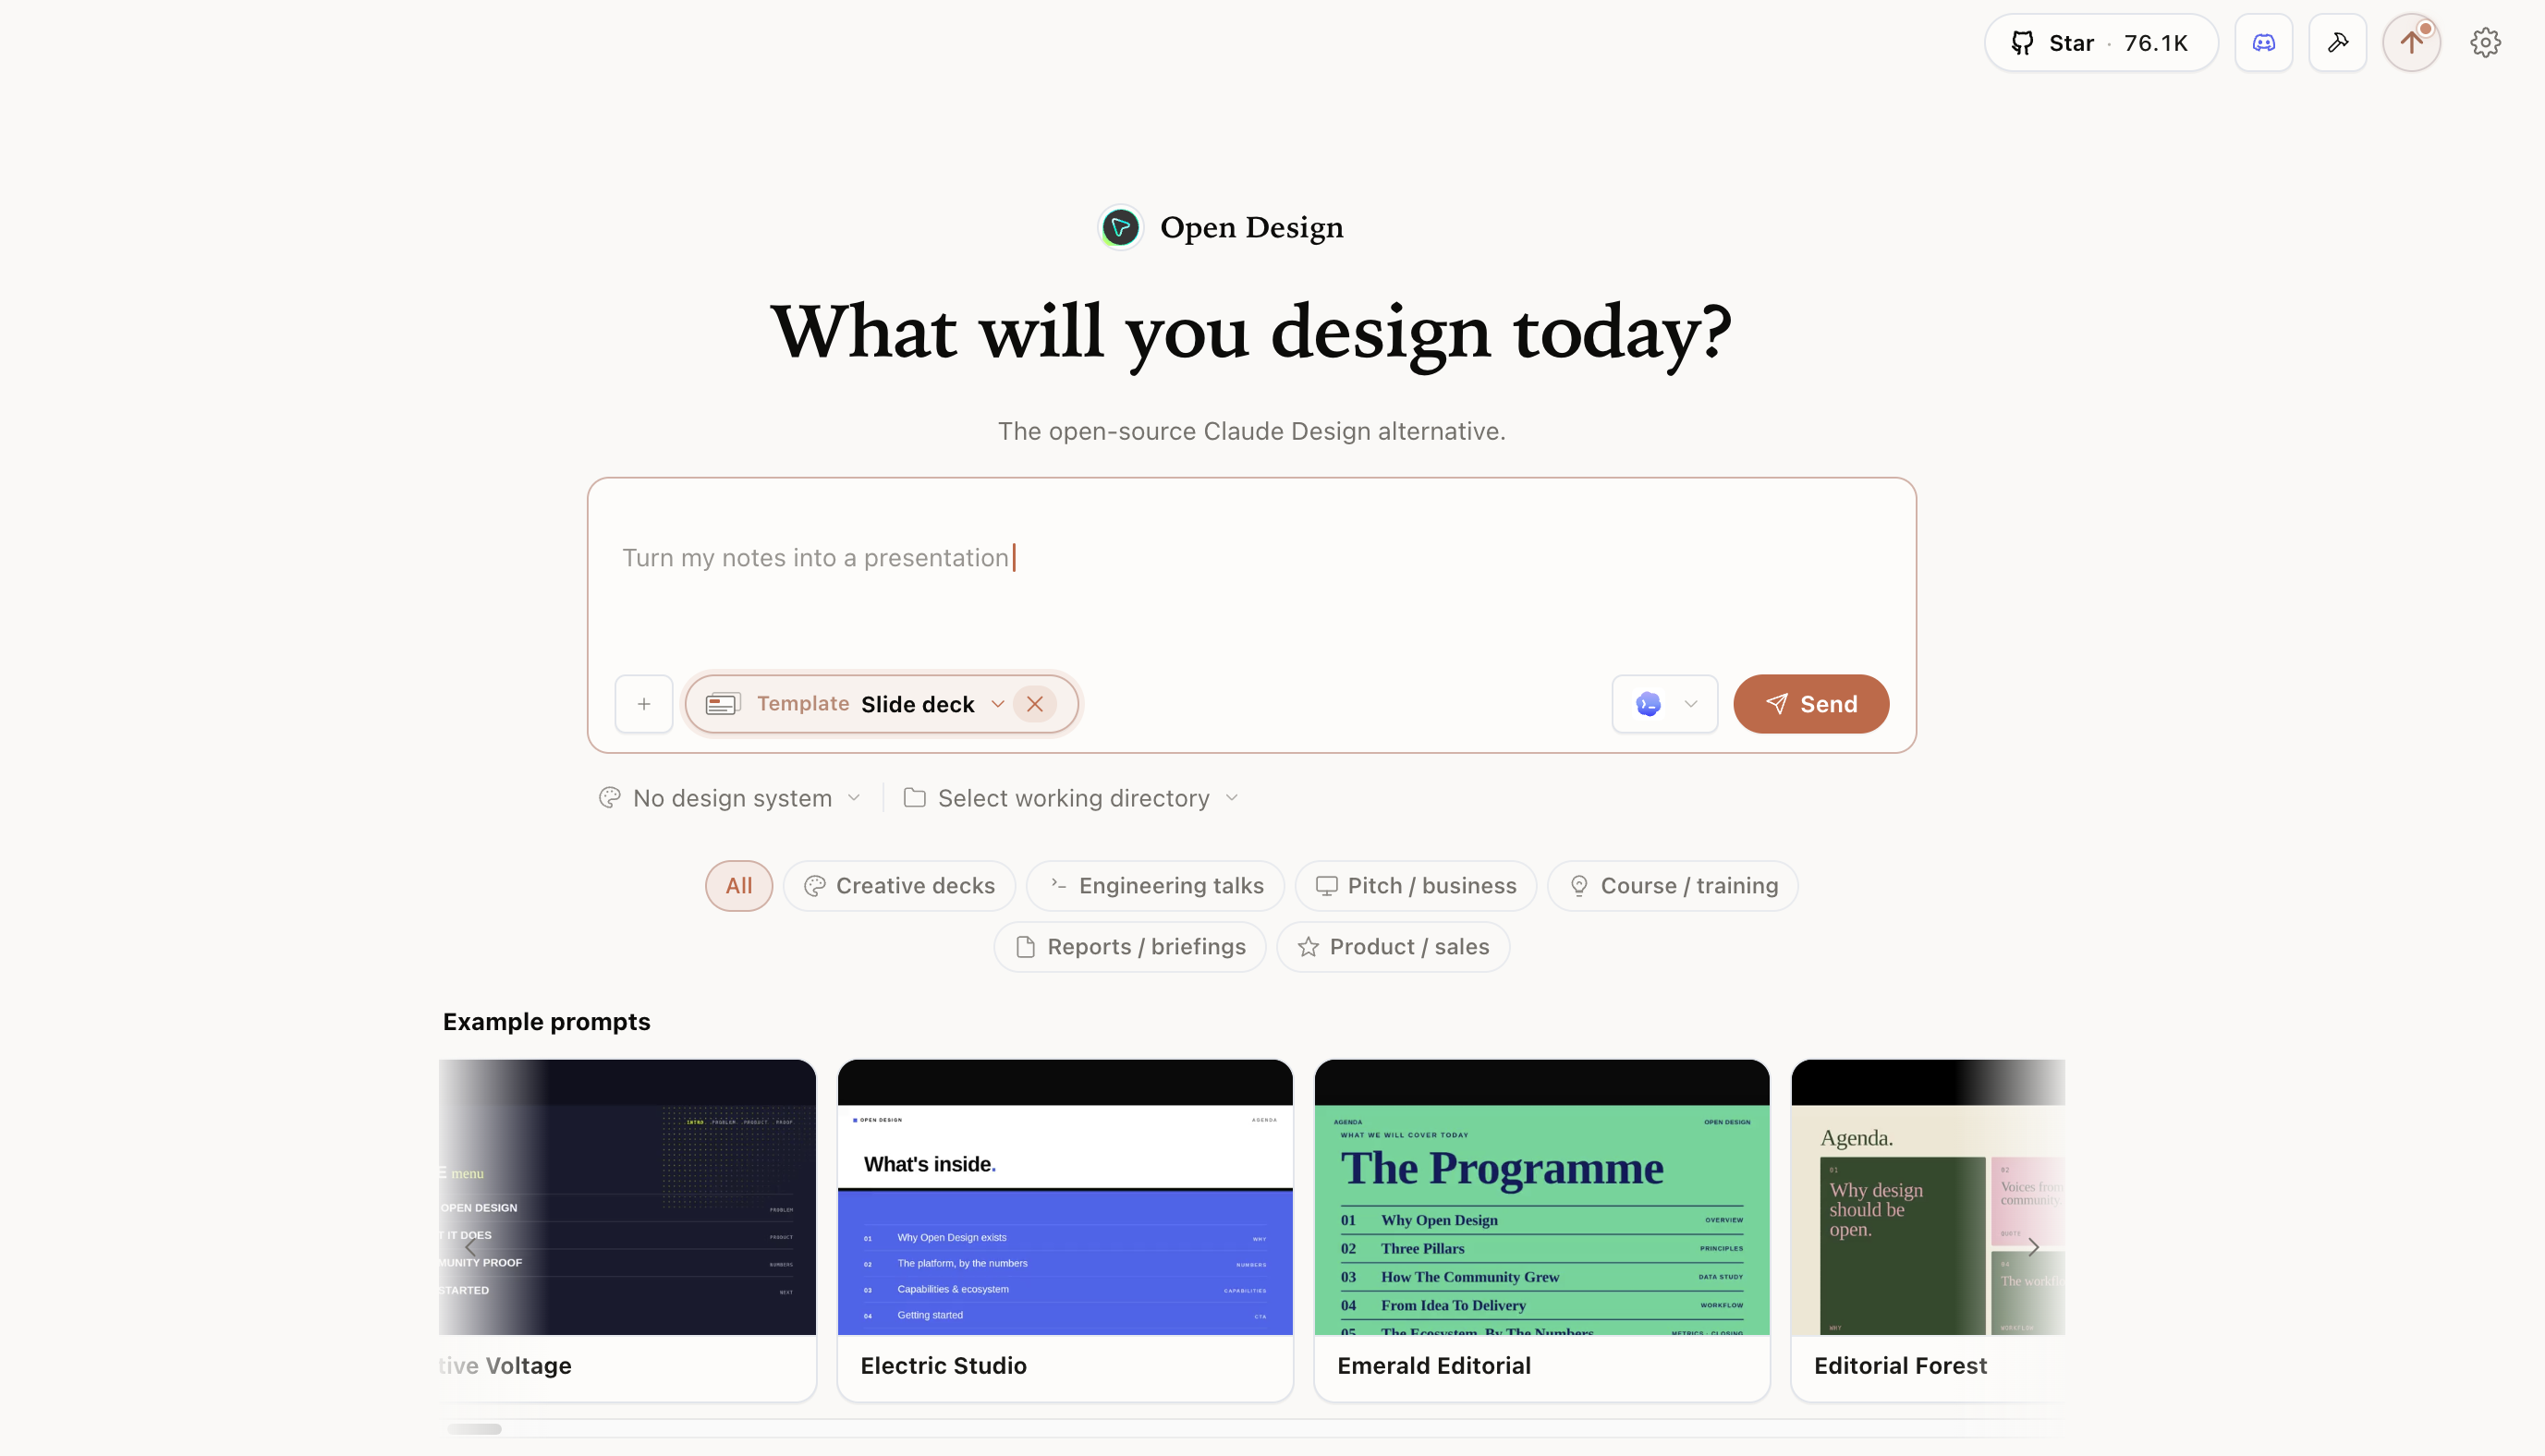
Now switch to Deck Mode. Give OpenDesign the chosen reference image and the slide-by-slide content. Ask it to rebuild the deck in the visual style of the selected reference, but as editable HTML slides. This is the key difference between a static image workflow and an OpenDesign workflow. The output should not be a flat picture. It should be a deck you can inspect, edit, comment on, and continue improving.
Prompt 3: Deck Mode - create the first editable deck
I want to create a PPT deck.

Please use the attached reference image as the visual direction.

Important:
1. Recreate the selected style direction from the reference image.
2. Build the PPT as editable HTML-based slides.
3. Keep the slide ratio consistent with the reference image unless I specify otherwise.
4. Preserve the slide text and structure as much as possible.
5. Do not turn the whole deck into static images.
6. Make each slide visually polished, but keep it readable and presentable.

Selected visual style:
[DESCRIBE THE STYLE YOU CHOSE FROM THE IMAGE]

Slide content:
[PASTE THE FINAL SLIDE-BY-SLIDE CONTENT PLAN]

Please generate the first full version of the deck.
What to Expect from the First Version
The first deck may already be useful, but it usually will not fully match the reference image. This is normal. It may have weaker spacing, less texture, less dramatic typography, inconsistent visual density, or simplified layouts. Do not treat the first result as final. Treat it as a working draft.
Step 4: Compare the Generated Deck Against the Reference Image
Instead of saying “make it better”, make the AI compare the generated deck with the reference image. This creates a much more specific improvement loop. Ask it to diagnose the gap in layout, typography, texture, visual hierarchy, density, and mood.
Prompt 4: Diagnose the visual gap and improve the deck
Here is the original reference image again.

Please compare the current deck with the reference image.

Focus on:
1. Layout structure
2. Typography scale and personality
3. Color palette
4. Spacing and alignment
5. Visual hierarchy
6. Texture, depth, and atmosphere
7. Whether each slide feels like it belongs to the same design system

Do not only say what is different. Please improve the deck directly.

Use all available design and coding capabilities to close the gap while keeping the deck readable and editable.

After making changes, summarize:
1. What you changed.
2. Which slides improved the most.
3. What still needs manual review.
Workshop insight: this self-comparison loop is often the moment when the deck starts to feel designed instead of merely generated.
Step 5: Add Real Logos and Brand Assets
AI-generated decks often use text placeholders where real logos, product icons, screenshots, or brand assets should appear. This weakens credibility. Ask OpenDesign to identify where real assets are needed, search for them, download appropriate versions, and place them into the deck. For logos, be explicit: use official logos, preserve the original colors, and do not restyle them to match the deck. The deck can have a strong visual style, but brand assets should remain recognizable.
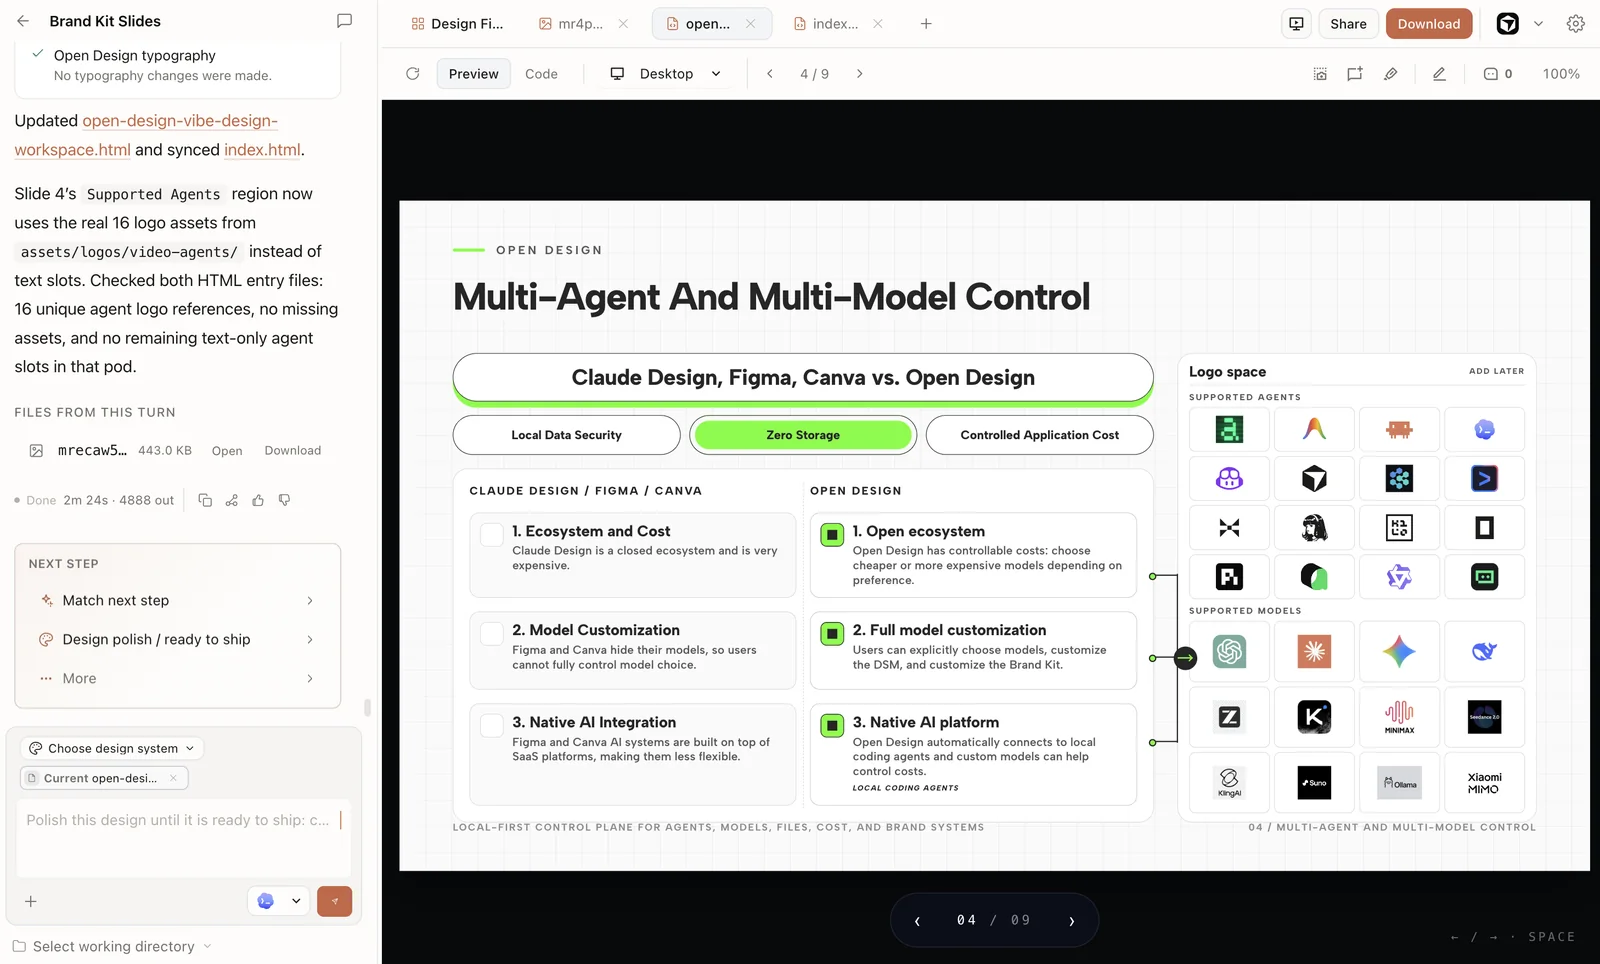
Prompt 5: Add official logos and brand assets
Please review the entire deck and identify where real external assets should be added.

Look for:
1. Company logos
2. Product logos
3. App icons
4. Platform screenshots
5. Public product images or interface references

Instructions:
1. Search for the appropriate official or high-quality assets.
2. Download and insert them into the relevant slides.
3. Keep logos in their original brand colors.
4. Do not recolor, distort, or redesign official logos.
5. Do not add assets to every slide. Only add them where they improve clarity, credibility, or recognition.
6. Make sure the inserted assets match the layout and do not make the slide crowded.

After updating the deck, tell me:
1. Which slides received new assets.
2. What assets were added.
3. Which assets may need manual verification.
Quality Check for Logos
- Are all logos recognizable and not distorted?
- Are official brand colors preserved?
- Are low-resolution or blurry assets removed?
- Does each logo support the slide message instead of acting as decoration?
Step 6: Add AI-Generated Images Where They Explain the Argument
After logos and real assets are added, the deck may still need conceptual visuals. These are not brand assets. They are images that help explain a point, create atmosphere, or make an abstract idea easier to understand. The key is to avoid decorative overuse. Do not ask for images on every slide. Ask the AI to decide which slides actually benefit from image generation, what each image should express, and where it should be placed.
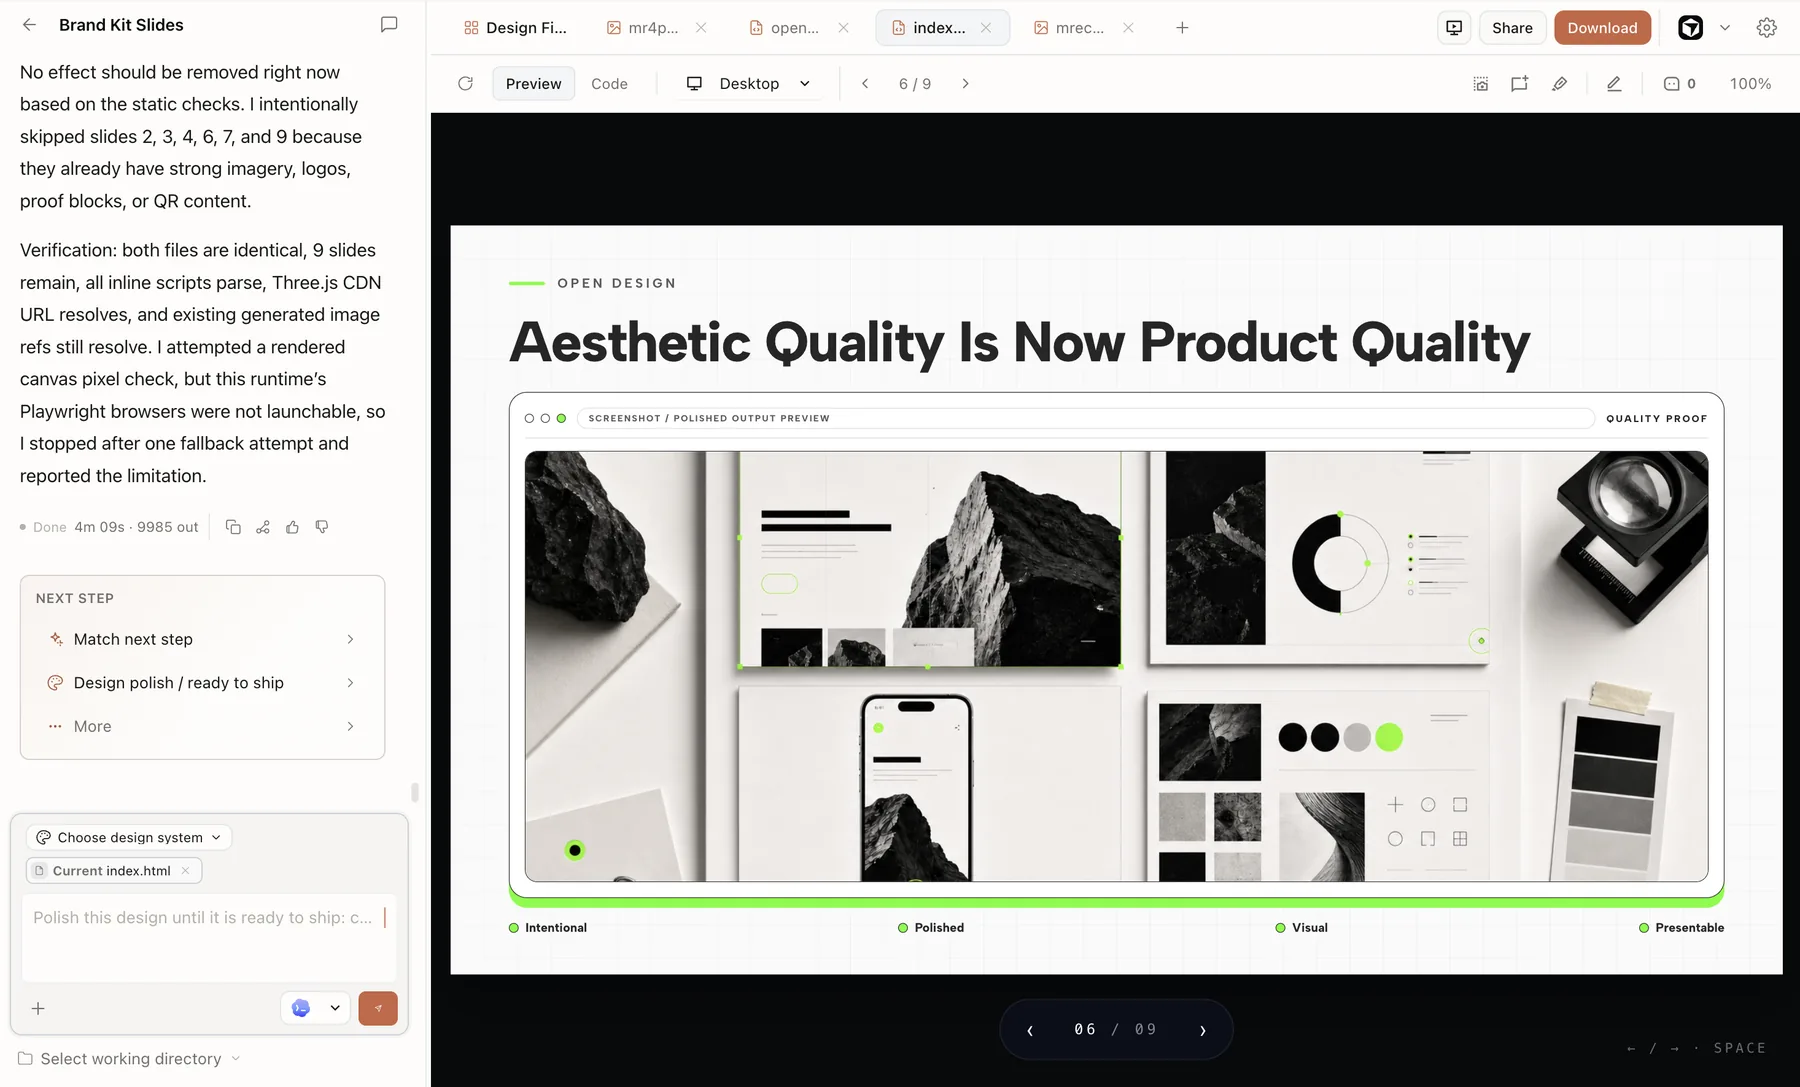
Prompt 6: Generate supporting visuals only where useful
Please review the whole deck and decide where AI-generated images would make the presentation clearer or more persuasive.

Instructions:
1. Do not add AI images to every slide.
2. Only add images where they help explain an idea, support an argument, or make a key moment more memorable.
3. Avoid adding images to slides that already have enough visual content.
4. Keep the image style consistent with the chosen deck style.
5. If image generation is available, generate the images and insert them into the deck.
6. If image generation is not available, write the image prompts I should use in another image generation tool.

For each image you add or recommend, tell me:
1. Slide number
2. Purpose of the image
3. The image prompt used
4. Why this slide benefits from an image
Rule of thumb: visuals should explain the argument, not decorate the slide. If an image does not make the idea easier to understand, remove it.
Step 7: Use ECharts for Data-Rich Slides
If the deck contains market comparisons, timelines, adoption trends, survey results, technical benchmarks, or research findings, add real charts instead of static images. ECharts is useful because the chart can be embedded into the HTML slide, styled to match the deck, and updated if the data changes. Ask the AI to scan the deck and identify which slides should use charts. Again, the instruction should be selective. A chart on every slide makes the deck noisy. A few strong charts can make the deck much more credible.
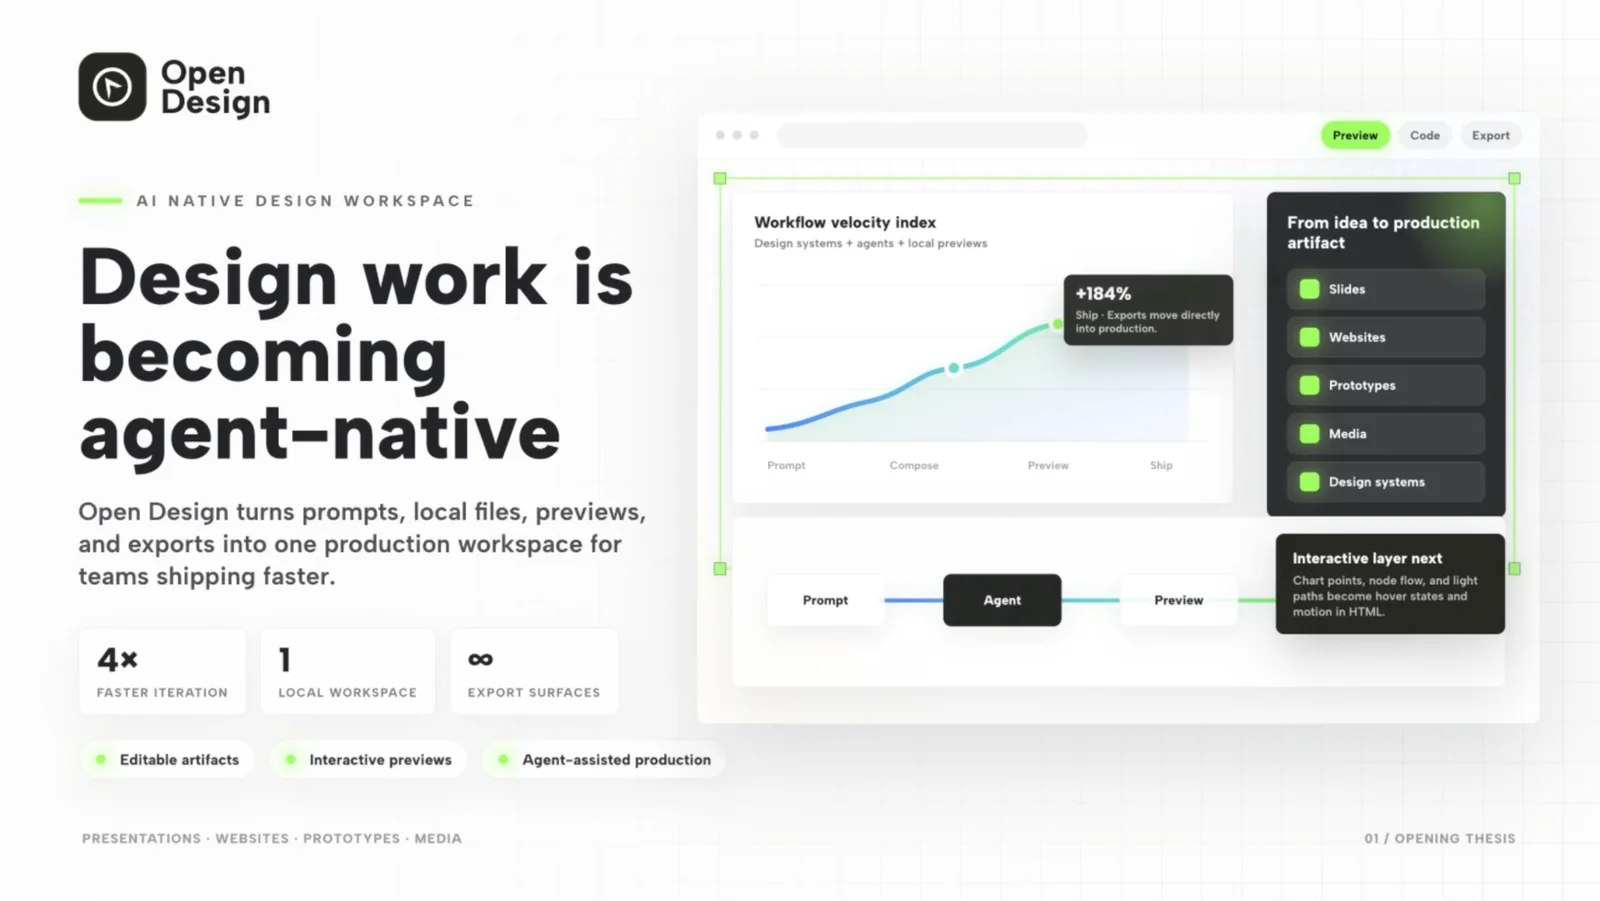
Prompt 7: Add ECharts where data visualization helps
Please scan the entire deck and identify slides where an ECharts visualization would improve understanding.

Use ECharts only where it is genuinely useful.

Consider charts for:
1. Comparisons
2. Trends over time
3. Rankings
4. Market share
5. Adoption curves
6. Survey results
7. Before/after metrics
8. Technical benchmarks

Instructions:
1. Do not add charts to every slide.
2. Choose the best chart type for each relevant slide.
3. Match the chart styling to the deck's visual system.
4. Use concrete data if available.
5. If exact data is missing, use clearly labeled illustrative data and tell me that it needs verification.
6. Place the chart so it supports the slide's key message.

After updating, summarize:
1. Which slides received charts.
2. What chart type was used.
3. What data was used.
4. Which data points need verification.| Content Type | Suggested Chart | Why It Works |
|---|---|---|
| Market growth | Line chart or area chart | Shows direction and momentum. |
| Competitive comparison | Bar chart or radar chart | Makes differences visible quickly. |
| Category share | Pie, donut, or treemap | Shows distribution at a glance. |
| Workflow stages | Funnel or stacked bar | Shows conversion or progression. |
Step 8: Add Three.js Visual Effects Only Where It Helps
Because OpenDesign decks are HTML-based, you can add web-native visual effects that traditional slide tools do not easily support. Three.js can create particles, 3D objects, subtle background depth, or spatial motion. Animation libraries can create entrance transitions, hover effects, section changes, or emphasis moments. Use this carefully. Motion should make the presentation more memorable or easier to understand. It should not make the slides harder to read.
Prompt 8A: Add subtle Three.js effects
Please scan the deck and identify where a subtle Three.js effect could improve the presentation.

Use Three.js only when it supports the slide's message.

Good uses:
1. A subtle animated background for the opening slide.
2. A 3D metaphor for a key concept.
3. Particle effects that add atmosphere without reducing readability.
4. A spatial visual that helps explain a system, network, or flow.

Instructions:
1. Do not add 3D effects to every slide.
2. Avoid visual clutter.
3. Keep text readable.
4. Keep performance reasonable.
5. Make the effect match the deck's visual style.

After updating, tell me:
1. Which slides received Three.js effects.
2. What effect was added.
3. Why it supports the slide.
4. Whether any effect should be removed for clarity.
Do not overuse motion. If the selected deck style is already colorful, dense, or highly expressive, use fewer 3D effects. If the deck style is minimal, subtle motion can add energy without making the design feel messy.
Step 9: Fine-Tune with Comment, Mark, and Edit
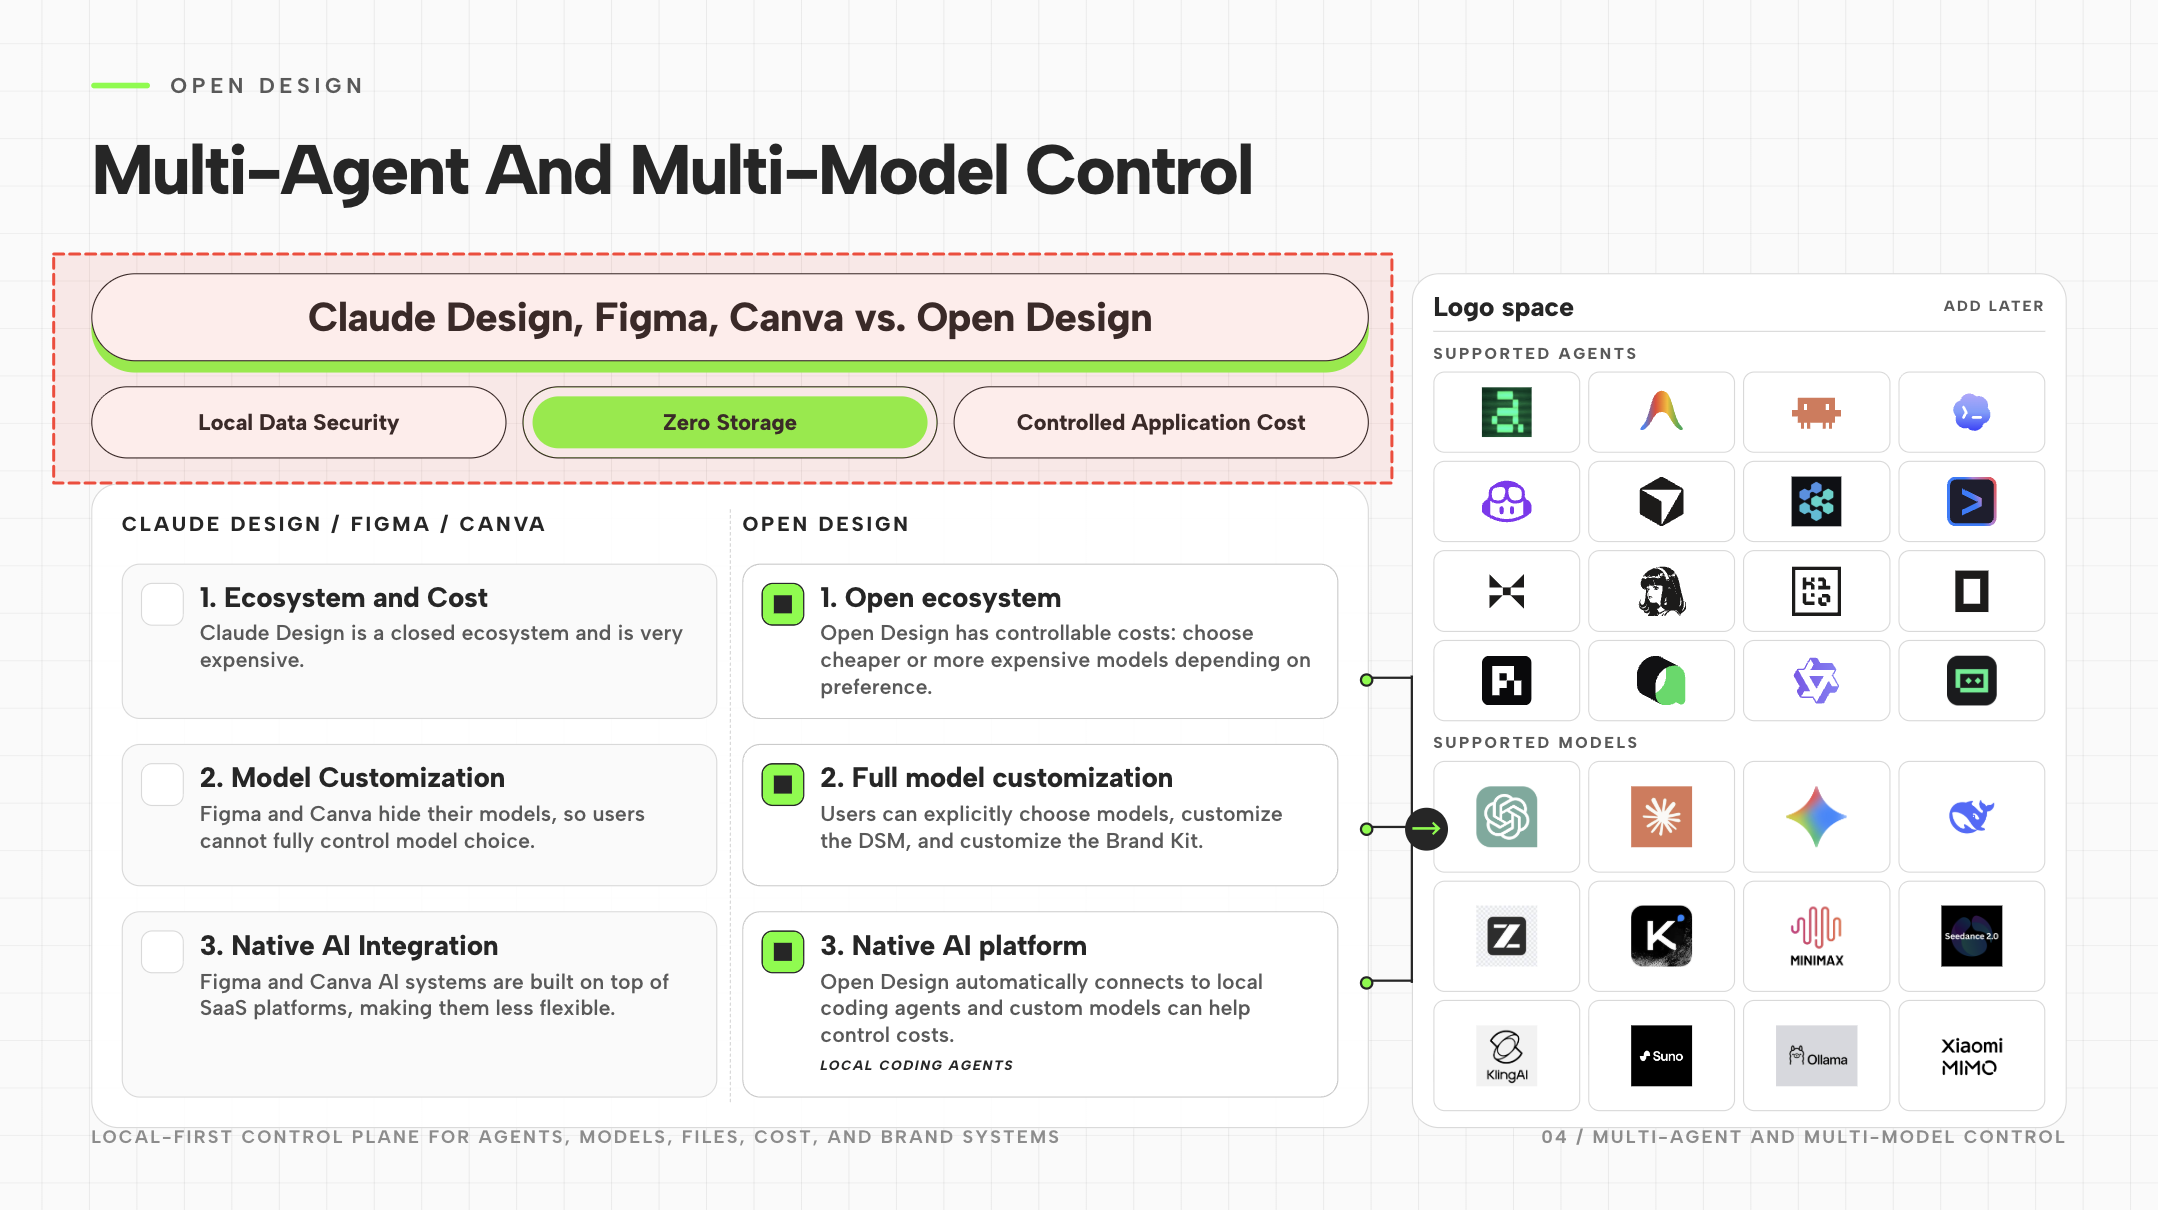
Comments
Use comments when the problem is attached to a specific slide element: a logo feels too large, a label needs different wording, a chart needs more breathing room, or a visual detail should be checked. This keeps feedback close to the exact object that needs work, so the next agent pass can act on the right part of the deck.
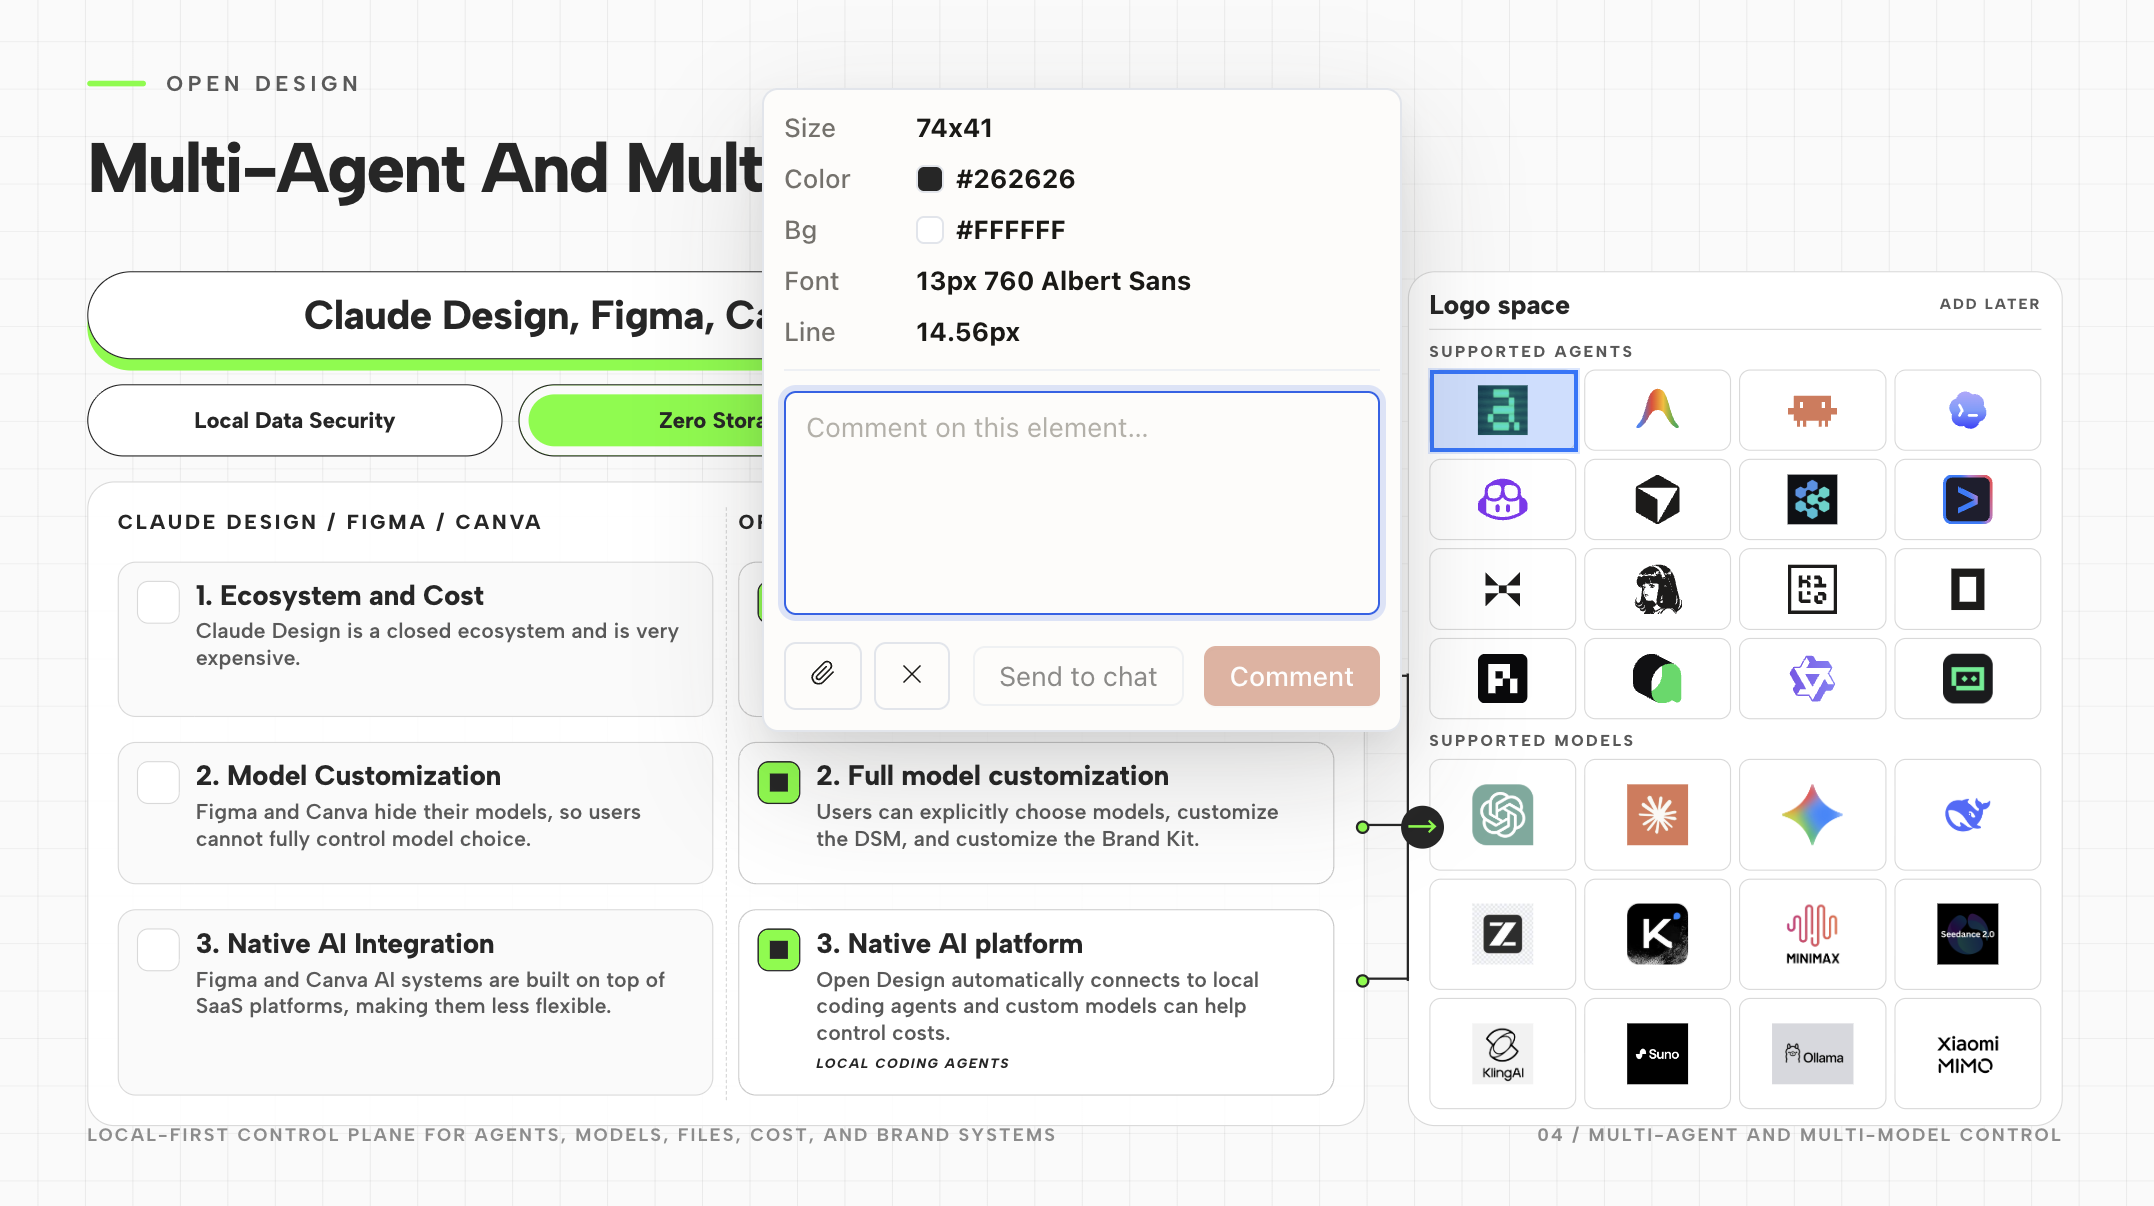
Mark
Use Mark when a visual area needs to be called out quickly. This is helpful for layout issues that are easier to show than describe, such as “this group feels too high”, “this section should align with the title”, or “the selected header needs more contrast”.
Edit
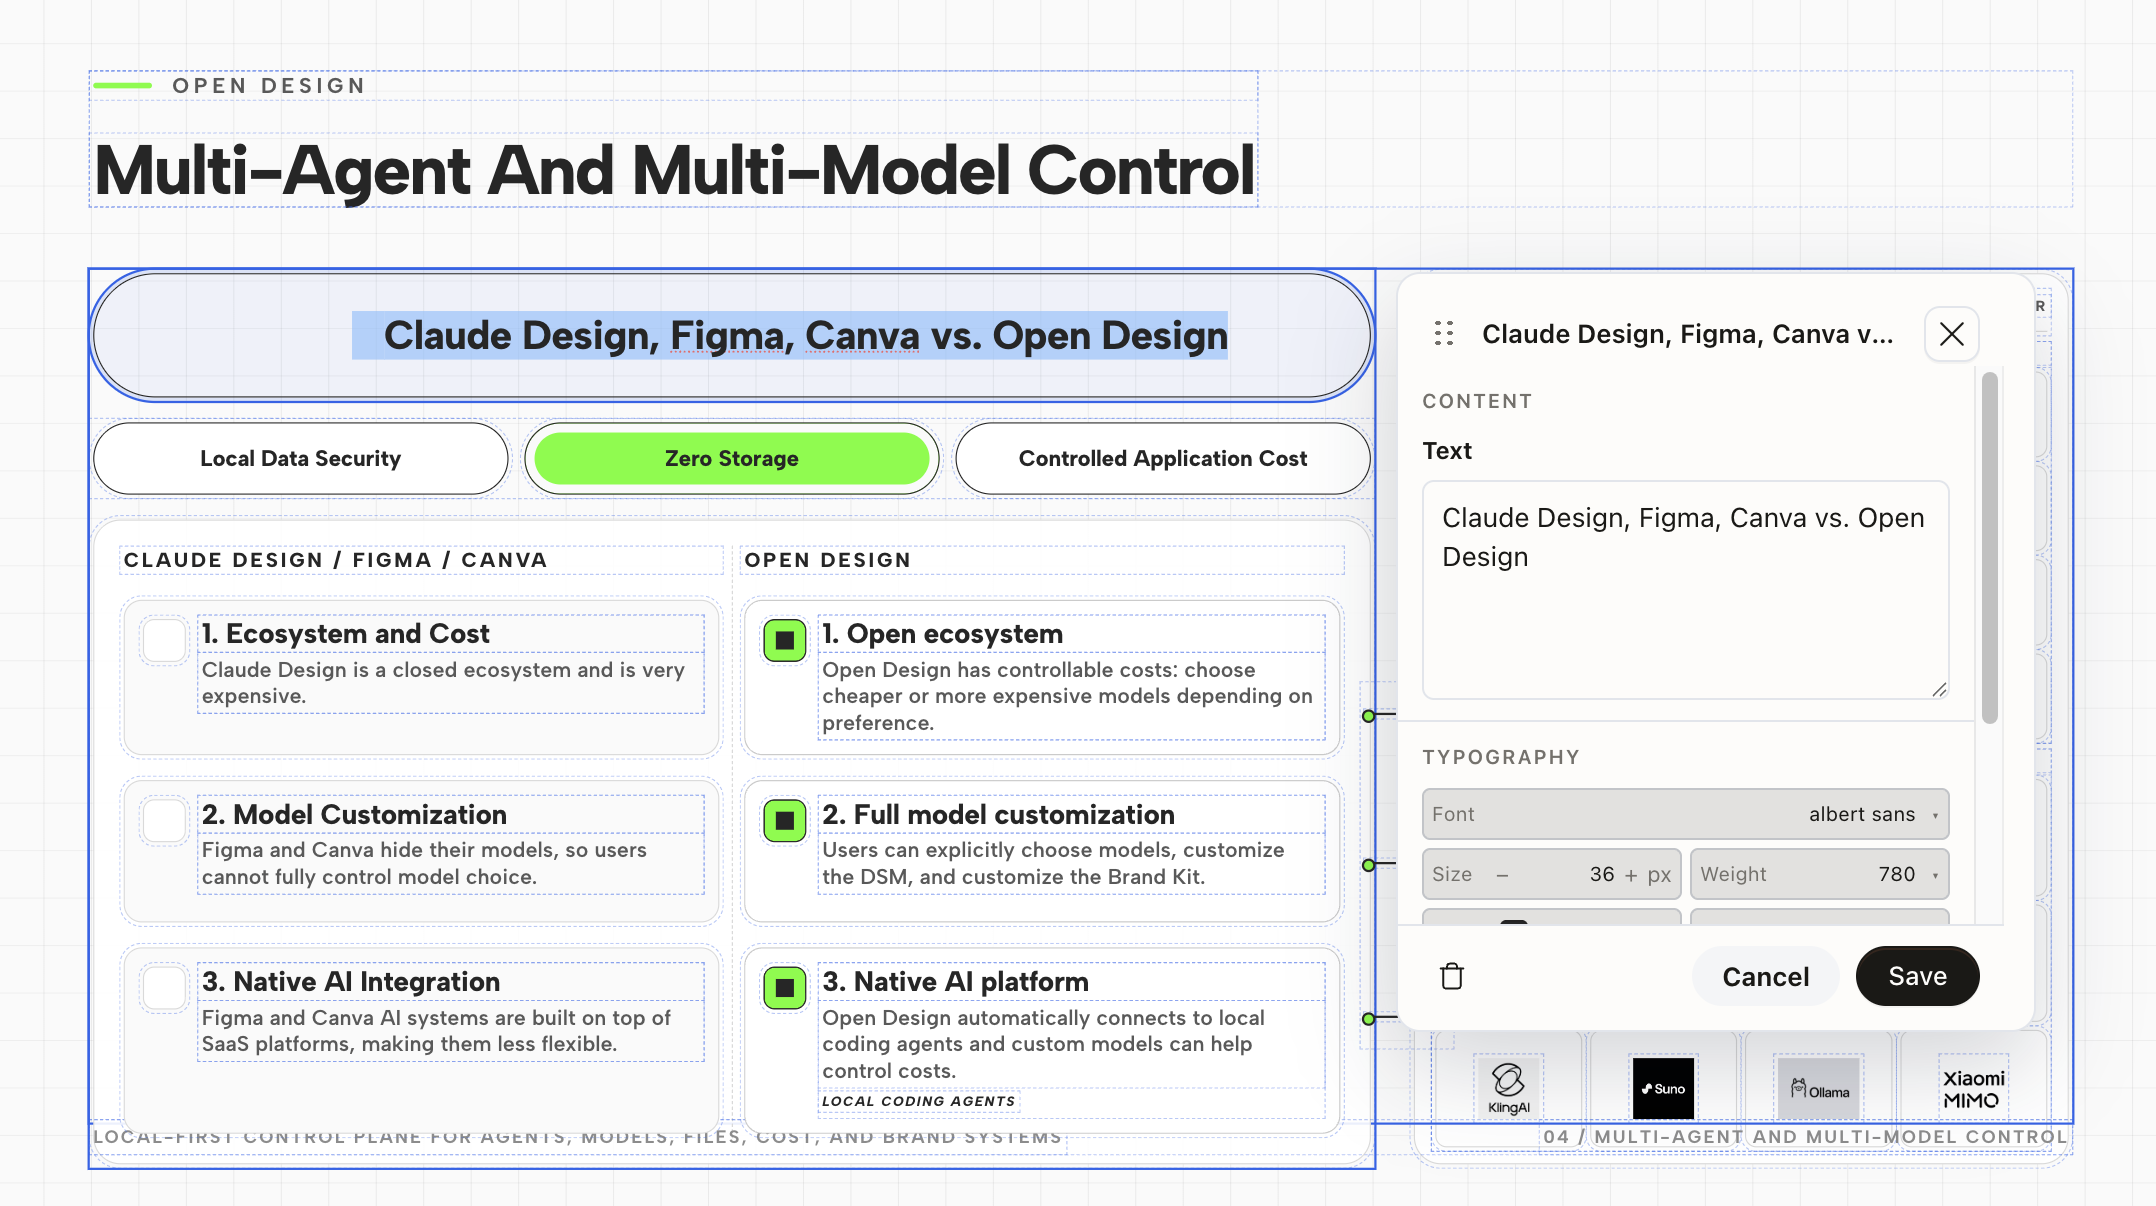
Use Edit when you already know the exact local change you want. Select the element, edit the text or style properties directly, and save the refinement without regenerating the whole deck. This is best for final wording, typography, and small layout fixes after the main design system is stable.
Step 10: Add Presentation-Level Transitions and Interactions
After the deck content, visuals, charts, 3D details, and local fixes are in good shape, add the final layer: process animation and interaction across the whole PPT. This is different from adding one visual effect to one slide. Here, the goal is to make the deck feel smooth when it is presented from beginning to end. Think of this as the presentation system: slide transitions, section changes, entrance timing, hover states, click interactions, and subtle emphasis animations. The best version should help the audience follow the story. It should not feel like a demo of animation effects.
Use this step last. If you add global animation too early, later content and layout edits may break the timing. Finish the deck first, then animate the presentation flow.
Prompt 10A: Add process animation and interactions to the whole PPT
Please add presentation-level process animation and interaction to the entire deck.

This should make the PPT feel smooth and polished when presented from beginning to end.

Please add:
1. Slide-to-slide transition effects.
2. Section-level transition moments when the topic changes.
3. Entrance animations for key titles, cards, charts, and images.
4. Subtle emphasis animations for the most important message on each slide.
5. Hover or click interactions only where they make sense.
6. Lightweight interactive details for charts, cards, or visual modules where appropriate.

Constraints:
1. Do not animate every element.
2. Do not make the deck flashy or distracting.
3. Keep all text readable and stable.
4. Keep chart labels and data visible.
5. Keep interactions simple enough for a live presentation.
6. Make the animation rhythm consistent across the whole deck.
7. Optimize performance so the deck does not lag during presentation mode.

After adding the animations and interactions, please summarize:
1. The transition style used across the deck.
2. Which slides received custom interaction.
3. Which slides received special entrance or emphasis animation.
4. Any slides where animation should be reduced or manually checked.| Animation Type | Good Use | Avoid |
|---|---|---|
| Slide transition | Signaling movement from one idea to the next | Using a different transition on every slide |
| Section transition | Marking a major shift in the story | Making small topic changes feel too dramatic |
| Entrance animation | Revealing hierarchy in titles, cards, and charts | Animating every paragraph or bullet point |
| Hover / click interaction | Letting the speaker reveal optional detail | Hiding essential information behind interactions |
Final Export and Presentation Notes
Because this workflow can include real assets, generated images, charts, 3D effects, and motion, export choices matter. If you export to a traditional slide format, some visual effects may be lost or rebuilt. If you export to static images or PDF, the visual design may be preserved but animations and interactions will not work.
| Format | Best For | Trade-off |
|---|---|---|
| Present in OpenDesign | Keeping motion, HTML layout, charts, and interactive effects | Requires presenting from the OpenDesign environment |
| PDF or images | Sharing a stable visual version | Motion and interaction are lost |
| PPTX | Compatibility with traditional presentation tools | Complex HTML visuals may not convert perfectly |
| HTML | Web-native sharing and archiving | External assets and generated effects need careful verification |
Recommended approach: if the deck uses charts, 3D, and motion, present directly in OpenDesign when possible. If you need a shareable backup, export a PDF or image version after the final QA pass.
Complete Prompt Library
Use this section as a compact copy-and-paste reference. Replace the bracketed variables with your own topic, audience, content, and constraints.
| Prompt | Use It When | Where |
|---|---|---|
| Prompt 0 | You need to clarify the story and decision logic. | Any AI chat |
| Prompt 1 | You need one image with multiple visual style options. | OpenDesign Image Mode |
| Prompt 1B | You want AI to help choose the best visual direction. | OpenDesign chat or any AI chat |
| Prompt 2 | You need a slide-by-slide content plan. | Any AI chat |
| Prompt 3 | You are ready to create the first editable deck. | OpenDesign Deck Mode |
| Prompt 4 | The first deck needs to become closer to the reference image. | OpenDesign chat |
| Prompt 5 | You need real logos and product assets. | OpenDesign chat |
| Prompt 6 | You want AI-generated images only where useful. | OpenDesign chat |
| Prompt 7 | You need charts for data-heavy slides. | OpenDesign chat |
| Prompt 8A | You want restrained 3D visual effects. | OpenDesign chat |
| Prompt 10A | You are ready to add final process animation and interaction to the whole PPT. | OpenDesign presentation / chat |